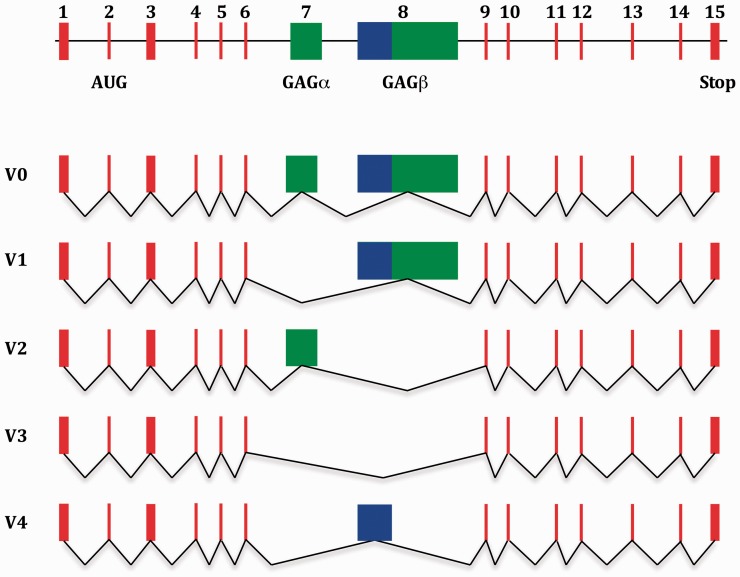
Figure 1.
Schematic representation of the genomic structure of the versican gene, including exon structure of the five known splice variants. Its 15 exons are represented as colored rectangles. Exons 1 to 6 and 9 to 15 are represented by red rectangles. Exons 7 and 8 are represented by green rectangles. The part of exon 8 that is expressed in versican V4 is represented by a blue rectangle. The black line between the exons in the top illustration represents non-coding intervening sequences. The black lines that connect the exons in the representation of the different splice variants illustrate the splicing process through which the different versican variants are generated. Note that the start-codon for versican biosynthesis is located within exon 2. GAG: glycosaminoglycan.

