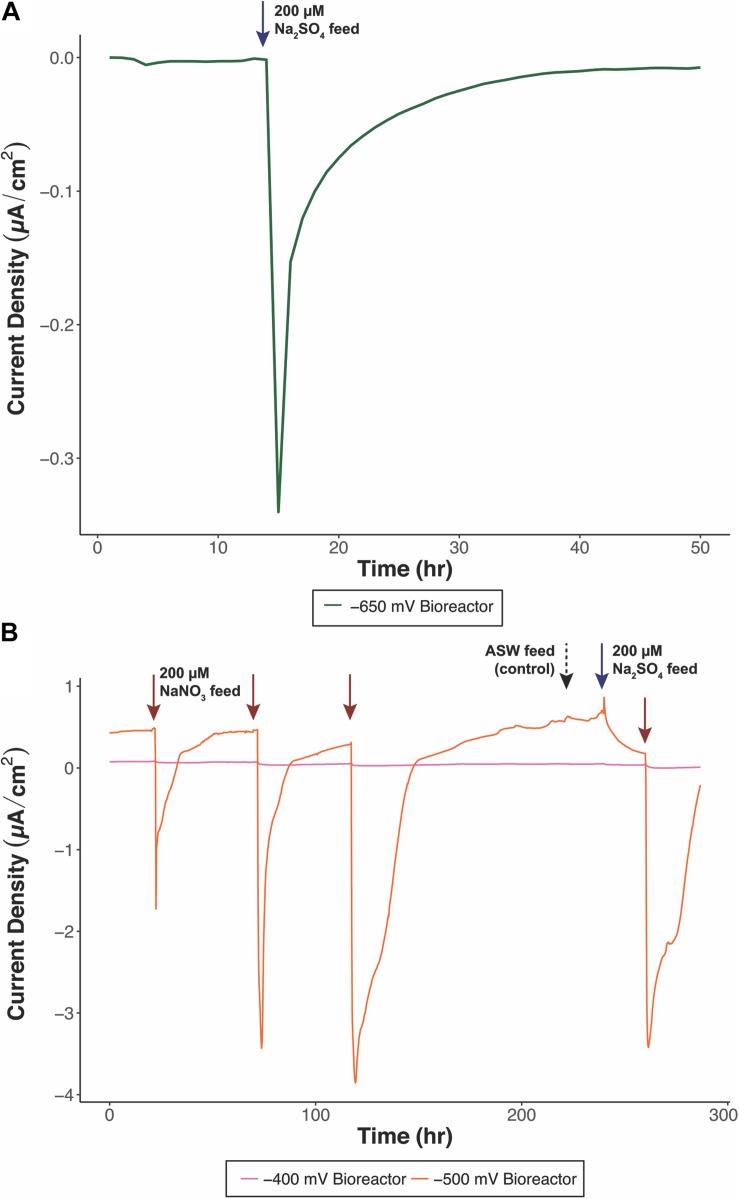
FIGURE 1.
Representative chronoamperometry profiles of electrochemical bioreactors, (A) –650 mV (vs. Ag/AgCl) bioreactor fed with sulfate as TEA and (B) –400 mV (orange) and –500 mV (pink) (vs. Ag/AgCl) bioreactors fed with nitrate as the primary TEA. Blue arrows indicate sulfate feeds, red arrows indicate nitrate feeds, and the black dashed arrow indicates an artificial seawater base feed. Sulfate and nitrate additions correspond to a final concentration of 200 μM.

