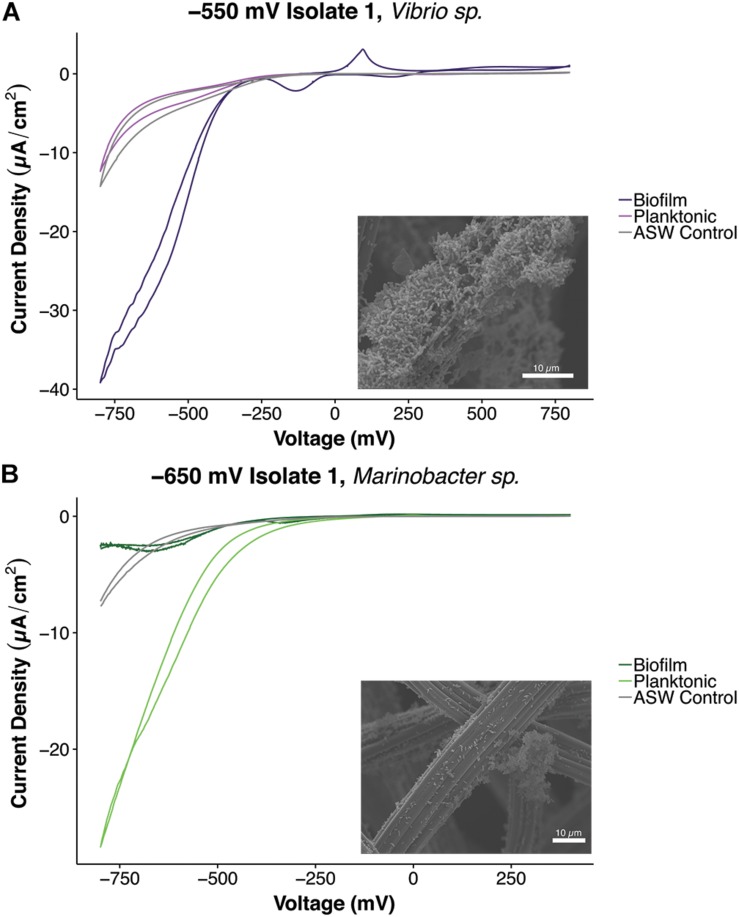
FIGURE 6.
Plots of cyclic voltammetry tests conducted under non-turnover conditions of different cell fractions and scanning electron microscopic characterization of biofilms of isolates, (A) –550 mV Isolate 1, Vibrio sp. and (B) –650 mV Isolate 1, Marinobacter sp. Separate cyclic voltammetry curves were obtained for planktonic and biofilm fractions. The Vibrio strain exhibited electrochemical activity in the biofilm state, and the Marinobacter strain demonstrated electrochemical activity in both the planktonic and biofilm fractions. CV curves shown were the average curves obtained after running three cycles (curves) for all tests.

