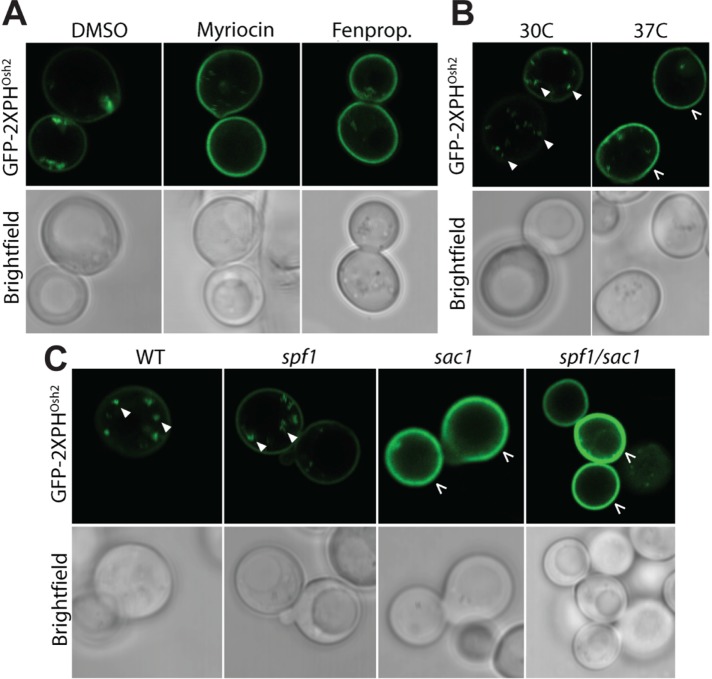
FIGURE 10:
Redistribution of PI4P in response to sterol dyshomeostasis is a function of SAC1 but not SPF1. Intracellular localization of PI4P was detected by the fluorescent lipid-associated GFP-2XPHOsh2 PI4P reporter construct. (A) Inhibition of sterol and sphingolipid biosynthesis by fenpropimorph (Fenprop.; 0.121 μg/ml) and myriocin (0.4 μg/ml), respectively, results in accumulation of PI4P in the PM. In the control, DMSO was added. (B) Increasing the temperature from 30 to 37°C results in accumulation of PI4P in the PM. (C) Deletion of SAC1, but not SPF1, results in accumulation of PI4P in the PM. Filled arrows, PI4P in intracellular spots most likely representing Golgi membranes. Broken arrows, PM. All images are representative of individual cells: A, B, n = 20; C, WT, n = 36; sac1, n = 25; spf1, n = 25; sac1/spf1, n = 29.

