FIGURE 5:
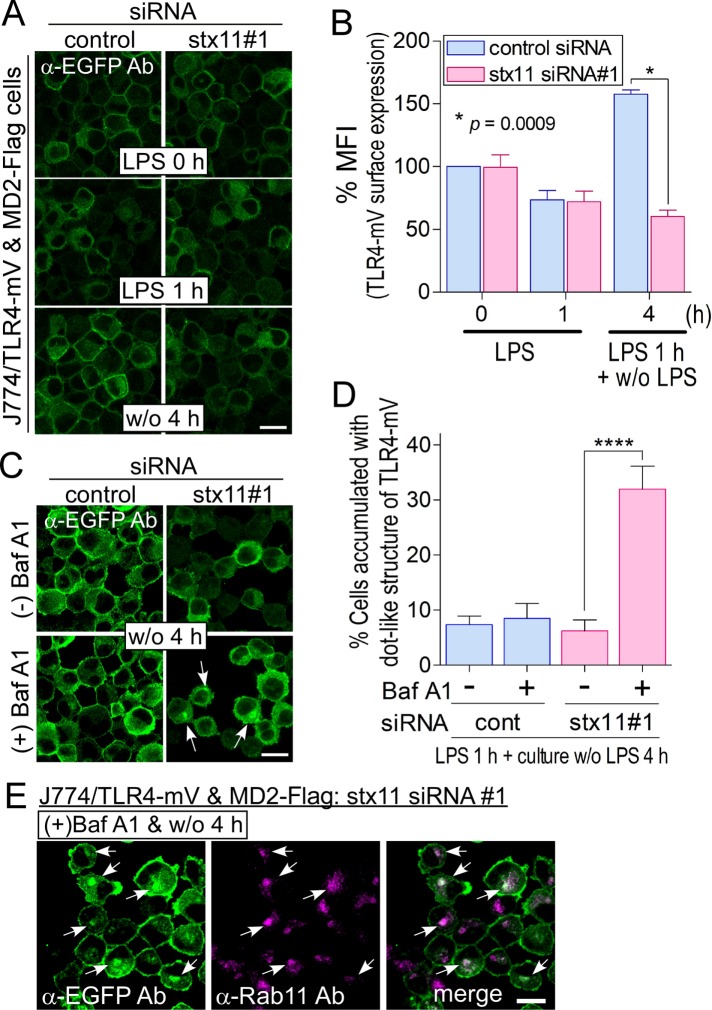
TLR4-mVenus is replenished via BafA1-sensitive compartments upon LPS stimulation. (A) J774 cells expressing TLR4-mVenus and MD2-Flag (J774/TLR4-mV and MD2-Flag cells) were treated with siRNAs and LPS as described in Figure 3A. The cells were stained with anti-EGFP antibodies followed by fluorescent dye–conjugated goat anti-rabbit secondary antibodies. (B) Fluorescence intensity of the plasma membrane of each cell (of at least 30 cells) from A was quantified using ImageJ. Each intensity value was normalized to that of control cells in the absence of LPS, defined as 100%. Data are presented as the means ± SE of three independent experiments. (C) siRNA-transfected J774/TLR4-mV and MD2-Flag cells were treated with LPS for 1 h and then incubated for an additional 4 h without LPS in the presence or absence of BafA1 (final: 10 nM). Imaging analysis was performed as described in A. (D) The number of accumulated cells of distinct dot-like structures of TLR4-mV was analyzed by microscopy. Results are expressed as the percentage of cells accumulating dot-like structures of TLR4-mV (more than 35 cells for each experiment). Data are presented as the means ± SE of four independent experiments. (E) J774/TLR4-mV and MD2-Flag cells were treated as described in C. The cells were fixed and stained with anti-EGFP and anti-Rab11 antibodies followed by fluorescent dye–conjugated secondary antibodies. Statistical analyses were performed using two-tailed, paired Student’s t tests (B) or one-way ANOVA with Tukey’s post hoc tests (D; ****, p < 0.001). White arrows indicate accumulated dot-like structures of TLR4-mV. Scale bar: 10 μm.

