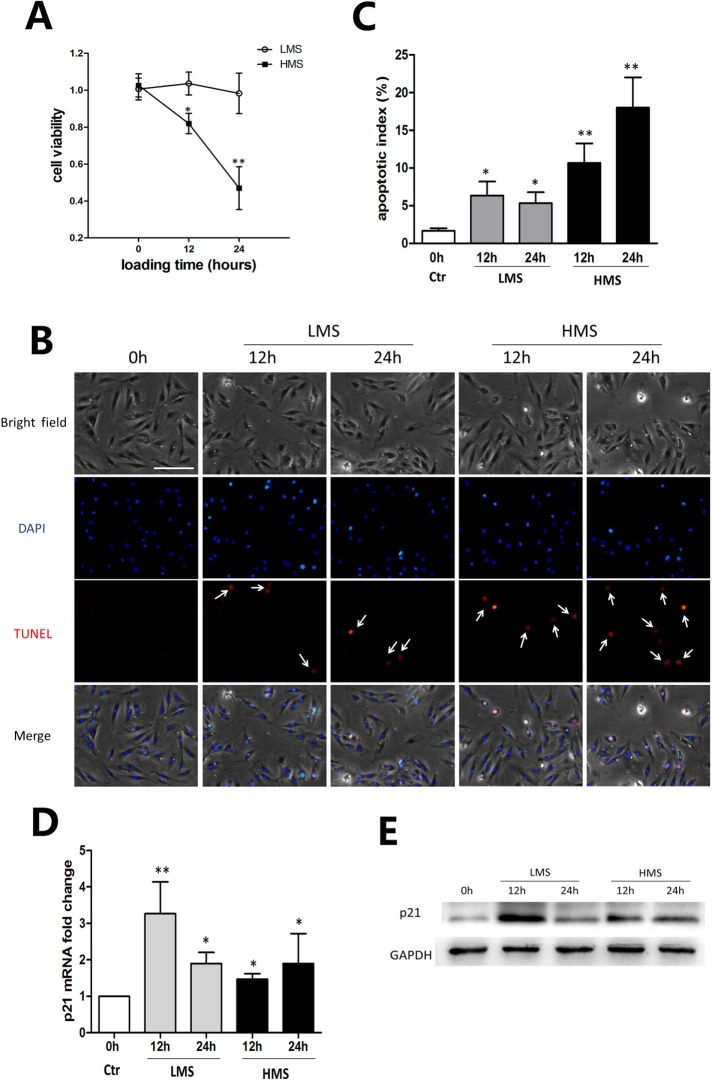
FIGURE 1:
HMS-promoted apoptosis of C2C12 myoblasts. (A) C2C12 cells were subjected to stretches of 10 and 20% magnitudes for 12 and 24 h, and cell viability was tested by MTT assay. (B) Cells were stretched with 10 and 20% magnitudes for 12 and 24 h, followed by TUNEL and DAPI staining. The apoptotic nuclei were recognized by TUNNEL staining (white arrow). Scale bar, 50 μm. (C) The apoptotic nuclei and total nuclei were counted, and apoptotic index was calculated as the percentage of apoptotic nuclei in total nuclei number per field. Three different fields are included, and data are shown as mean ± SD. (D) Real-time PCR was performed to examine the mRNA level of p21 after stretching of 10 and 20% magnitudes for 12 and 24 h. (E) Representative WB result of p21 protein level after stretching of 10 and 20% magnitudes for 12 and 24 h. The data represent the average of at least three separate experiments. Error bars indicate ± SD for triplicate. Significant differences are indicated by asterisks: *, P < 0.05 and **, P < 0.01, compared with static control cells.

