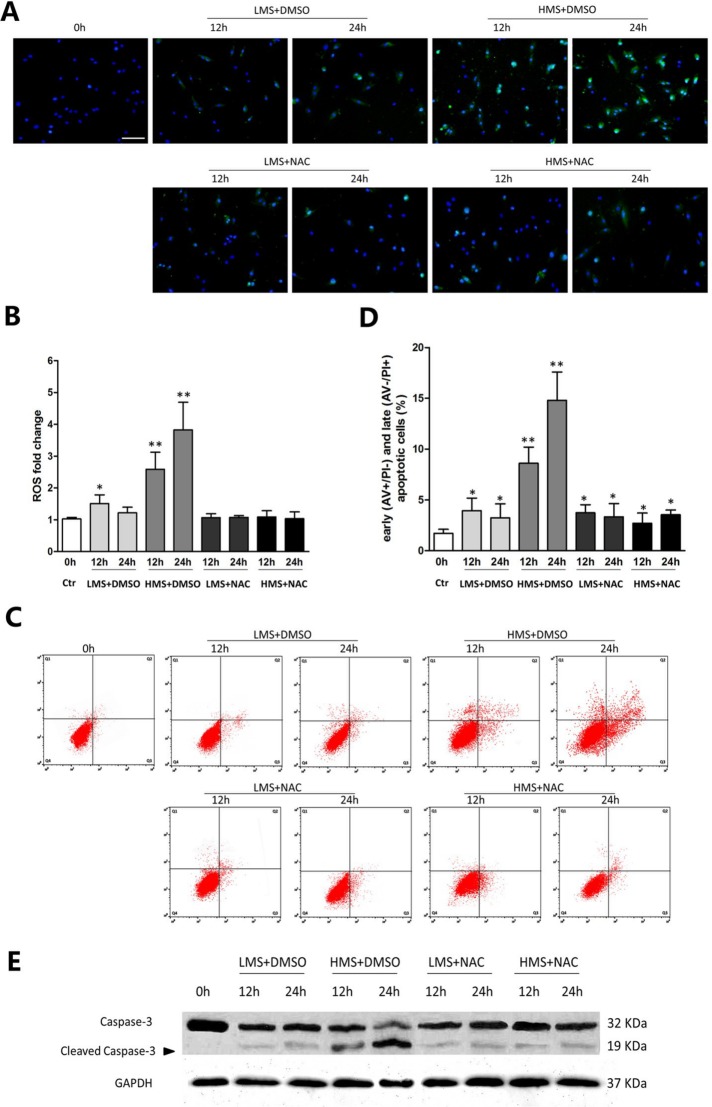
FIGURE 2:
ROS overloading was involved in HMS-induced apoptosis of myoblasts. (A) 2′,7′-Dichlorodihydrofluorescein diacetate (DCFDA) and DAPI staining of myoblasts subjected to LMS and HMS for 12 and 24 h. ROS generation was observed under the fluorescence microscope. Scale bar, 100 μm. (B) ROS levels per 5000 cells of each group were calculated by Microplate Fluorescence Reader FL600, and the data were normalized to values obtained from the control group. (C) AV/PI staining and flow cytometry analysis displayed drastic apoptosis of HMS-stretched myoblasts and attenuated apoptosis when ROS generation was suppressed by NAC. (D) Statistical analysis of the percentage of early (AV+/PI−) and late (AV−/PI+) apoptotic cells subjected to stretch. Data combined from three independent experiments are presented as mean ± SD. (E) Western blots were performed using caspase-3 primary antibody. Same samples were immunoblotted by GAPDH as the loading control. Black arrow indicates the cleaved capase-3 fragment with molecular size around 19 kDa. Significant differences are indicated by asterisks: *, P < 0.05 and **, P < 0.01, compared with static control cells.

