
FIGURE 3:
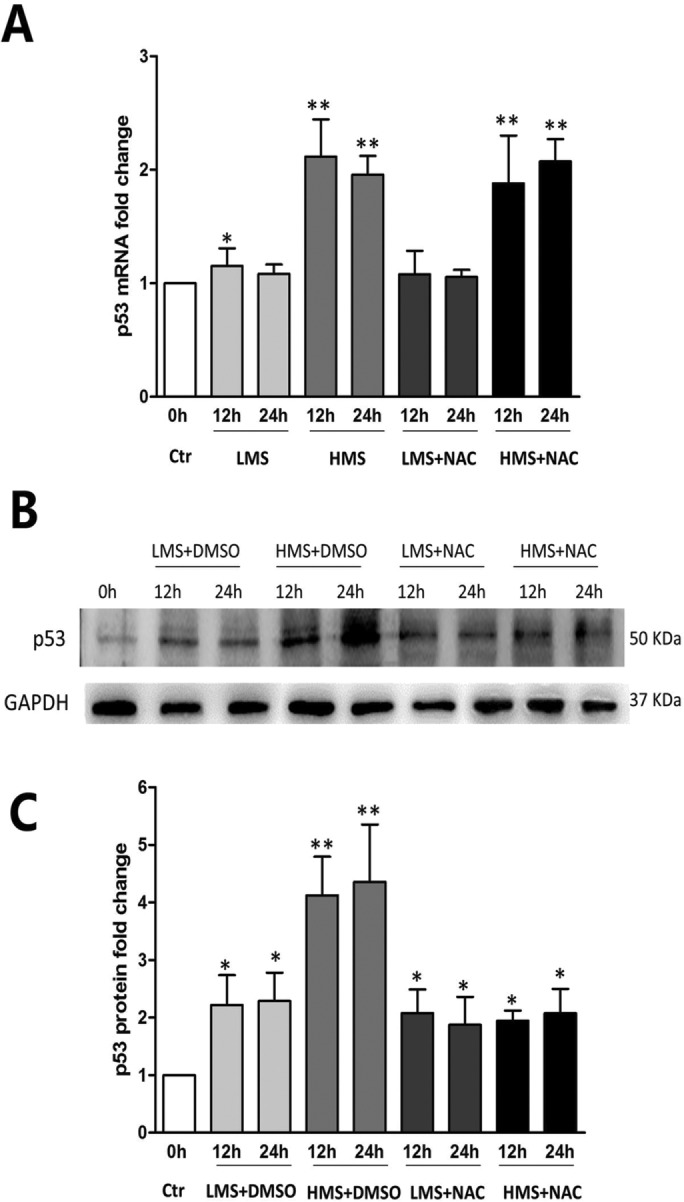
Stretch-induced elevation of p53 protein level was partially related to ROS production. (A) Real-time PCR displayed the p53 mRNA level of myoblasts under LMS or HMS stimuli with or without NAC pretreatment. (B) Representative WB result of p53 protein level in myoblasts under LMS or HMS stimuli with or without NAC pretreatment. (C) Densitometric analysis of p53 protein expressions. Data were analyzed by one-way ANOVA and are presented as mean ± SD. Significant differences are shown by *, P < 0.05 and **, P < 0.01, compared with static control cells.