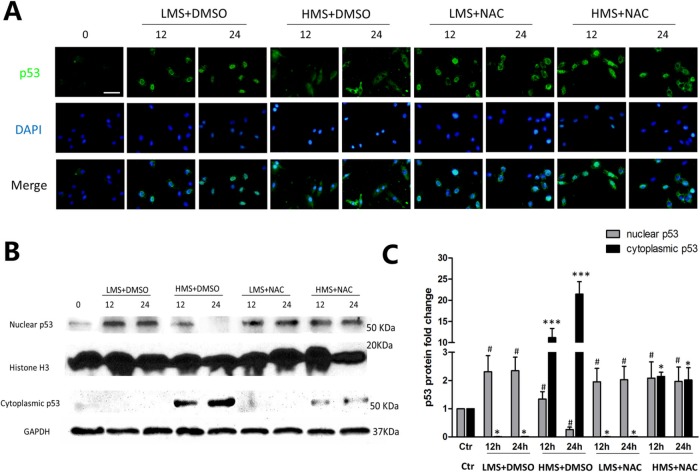
FIGURE 5:
The effect of ROS on subcellular localization of p53 in myoblasts under LMS or HMS stimuli. (A) Cells were loaded under either HMS or LMS for 12 and 24 h, with or without NAC pretreatment. After this, cells were fixed and permeabilized (see Materials and Methods) and then incubated with p53 antibody. After labeling, cells were extensively washed and localization of p53 was detected by immunofluorescence of anti-mouse IgG-FITC. The figure shows a representative immunostaining analysis after counterstaining with DAPI. (B) Protein samples from the above groups were separated for nuclear and cytoplasmic fractions, and WB experiments were applied using p53 antibody to detect p53 subcellular localization. H3 histone and GAPDH were used as loading controls of nuclear and cytoplasmic fractions. (C) Densitometric analysis of p53 protein expressions in nuclear or cytoplasmic samples. Data were analyzed by one-way ANOVA and are presented as mean ± SD. Significant differences are shown by *, P < 0.05 ; ***, P < 0.001 (nuclear sample); and #, p < 0.05 (cytoplasmic sample), compared with static control cells.

