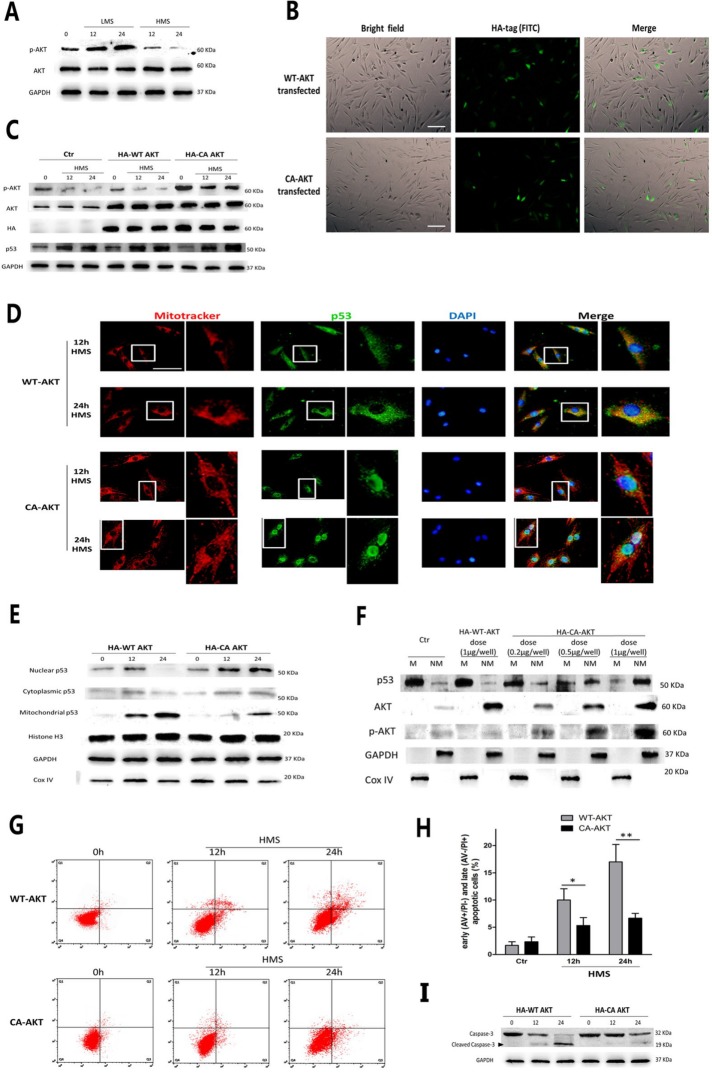
FIGURE 7:
HMS-inactivated AKT prompted p53 nuclear-mitochondrial redistribution and apoptosis. (A) WB results showed that AKT was phosphorylated in LMS-treated C2C12 cells and was dephosphorylated in HMS-treated cells. (B) Transfection efficiency of WT-AKT and CA-AKT plasmids were evaluated by immunostaining with HA antibody and observing green signal under the fluorescence microscope. (C) Representative WB results confirmed that transfecting both WT-AKT and CA-AKT vectors effectively raised the AKT level in both unstretched and HMS-stretched myoblasts, whereas only WT-AKT vector increased the p-AKT level. (D) Immunofluorescence results proved that C2C12 cells overexpressing CA-AKT resulted in p53 nuclear import subjected to HMS stimulation, comparing to the counterparts overexpressing WT-AKT that displayed p53 mitochondrial localization under HMS. The right pictures adjacent to the left ones were magnified pictures of the white rectangular area in the left pictures. (E) WB results further confirmed the diminished p53 level in mitochondrial fraction and raised the p53 level in the nuclear fraction in HMS-loaded C2C12 cells transfected by the CA-AKT vector. H3 histone, GAPDH, and Cox IV were used as markers of cytoplasmic, nuclear, and mitochondrial fractions, respectively. (F) Dose-dependent reduction of mitochondrial p53 and elevation of nonmitochondrial p53 in HMS-loaded C2C12 cells by transfection of CA-AKT vector. GAPDH and Cox IV were used as markers of nonmitochondrial and mitochondrial fractions, respectively. (G) AV/PI staining and flow cytometry analysis of apoptosis in HMS-treated C2C12 cells that were transfected with either WT-AKT vector or CA-AKT vector. (H) Statistical analysis of the percentage of early (AV+/PI−) and late (AV−/PI+) apoptotic cells in each group. Data were analyzed with Student’s t test for the CA-AKT group comparing to its negative control WT-AKT group in 12 and 24 h HMS-loaded cells. (I) Western blots were performed using caspase-3 primary antibody. Same samples were immunoblotted by GAPDH as the loading control. Black arrow indicates the cleaved capase-3 fragment with molecular size around 19 kDa. Significant differences are indicated by asterisks: *, P < 0.05 and **, P < 0.01, comparing WT-AKT with CA-AKT in 12 and 24 h loading groups.

