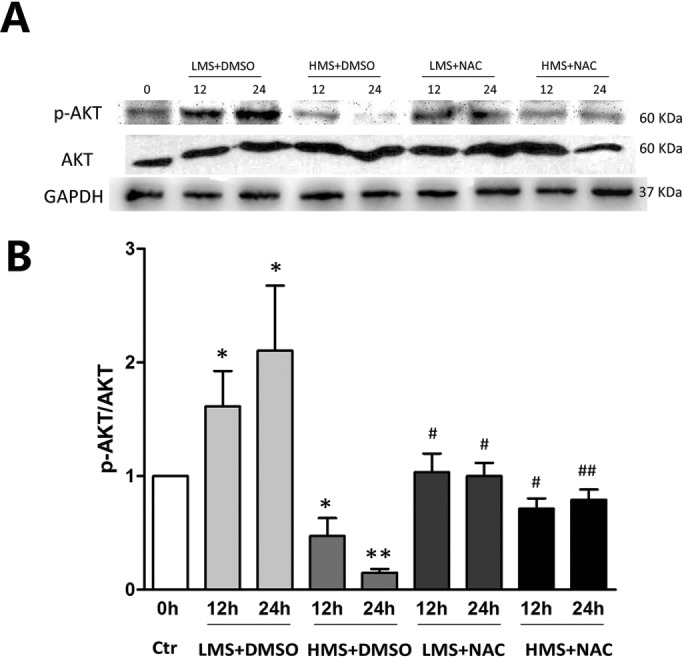
FIGURE 8:

Stretching magnitude–dependent regulation of AKT by ROS. (A) Cells were stretched by LMS or HMS for 12 and 24 h, with or without pretreatment with NAC. Phospho-AKT (Ser473) level and total-AKT level were detected by WB. The same samples were immunoblotted by GAPDH as the loading control. (B) Densitometric analysis of the ratio of p-AKT/AKT. Data were analyzed by one-way ANOVA and are presented as mean ± SD. Significant differences are shown by *, P < 0.05 and **, P < 0.01, compared with static control cells, while #, P < 0.05 and ##, P < 0.01 show the significant differences between the stretching alone group and the stretching combined with NAC pretreatment group.
