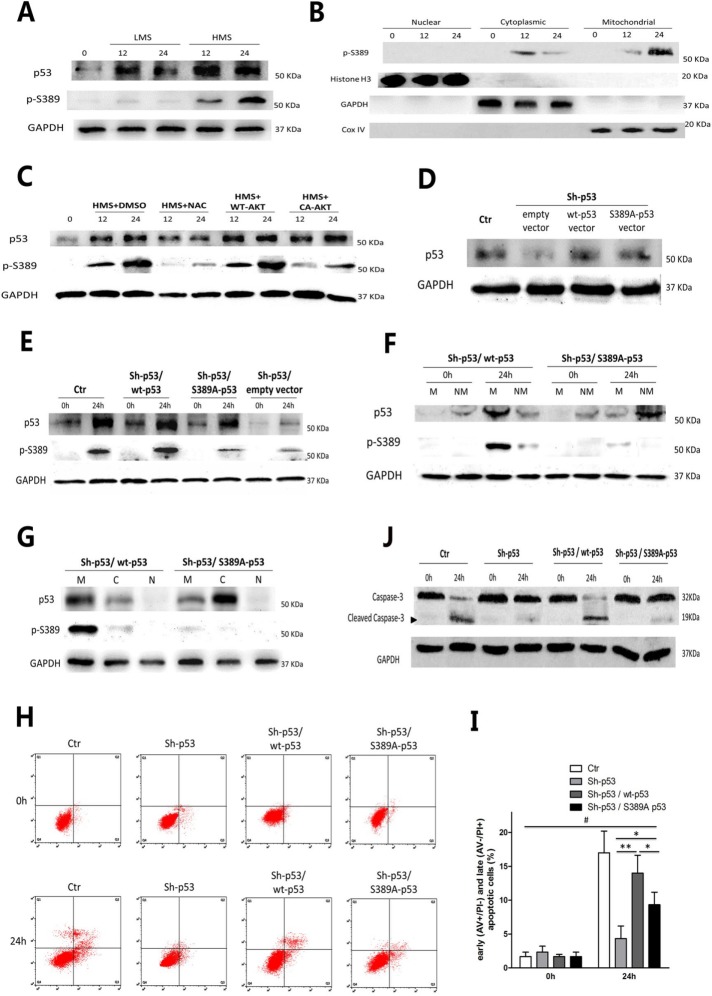
FIGURE 9:
Phosphorylation of p53 Ser389 was required for HMS-indued p53 mitochondrial translocation and myoblast apoptosis. (A) Cells were stretched by LMS or HMS for 12 and 24 h, and p53 phosphorylation on Ser389 was detected by WB. (B) Confirmation of phospho-p53 (Ser389) localization in HMS-loaded C2C12 cells for 12 and 24 h. H3 histone, GAPDH, and Cox IV were used as markers of cytoplasmic, nuclear, and mitochondrial fractions, respectively. (C) HMS-promoted phosphorylation of p53(Ser389) was dependent on the generation of ROS and subsequent dephosphorylation of AKT. Pretreatment with NAC or transfecting with CA-AKT vector efficiently blocked p53(Ser389) phosphorylation under HMS stimuli. (D) Transfection of p53-knockdown C2C12 cells with wild-type p53 vector or mutant p53 (S389A) vector partially rescued the p53 protein level. (E) Mutant p53 (S389A) could not be phosphorylated under 24 h–HMS stimuli, comparing to wild-type p53 in Sh-p53–infected C2C12 cells. (F) Mutant p53 (S389A) could not translocate into mitochondria under 24 h–HMS stimuli, comparing to wild-type p53. M and NM represent mitochondrial and nonmitochondrial portions, respectively. (G) After stimulated by HMS for 24 h, both mutant p53 (S389A) and wild-type p53 transfected cells were subjected to subcellular fraction assay, and the WB result confirmed that mutant p53 (S389A) was mainly accumulated in nonmitochondrial cytoplasm, comparing to wt-p53 that localized in mitochondria. M, C, and N represent mitochondrial, cytoplasmic, and nuclear portions, respectively. (H) AV/PI staining and flow cytometry analysis showed that transfecting wt-p53 vector could reverse the inhibited apoptosis in p53-knockdown C2C12 cells, whereas transfecting mt-p53 (S389A) failed to accomplish a similar effect. (I) Statistical analysis of the percentage of early (AV+/PI−) and late (AV−/PI+) apoptotic cells in each group. Data were analyzed by one-way ANOVA and are presented as mean ± SD. *, P < 0.05 and **, P < 0.01 represent the significant difference among the HMS-treated groups of C2C12 with distinct p53 expression. #, P < 0.05 shows the significant difference between static and stretched cells. (J) Representive WB results of caspase-3 cleavage in each group. Same samples were immunoblotted by GAPDH as the loading control. Black arrow indicates the cleaved capase-3 fragment with molecular size around 19 kDa.

