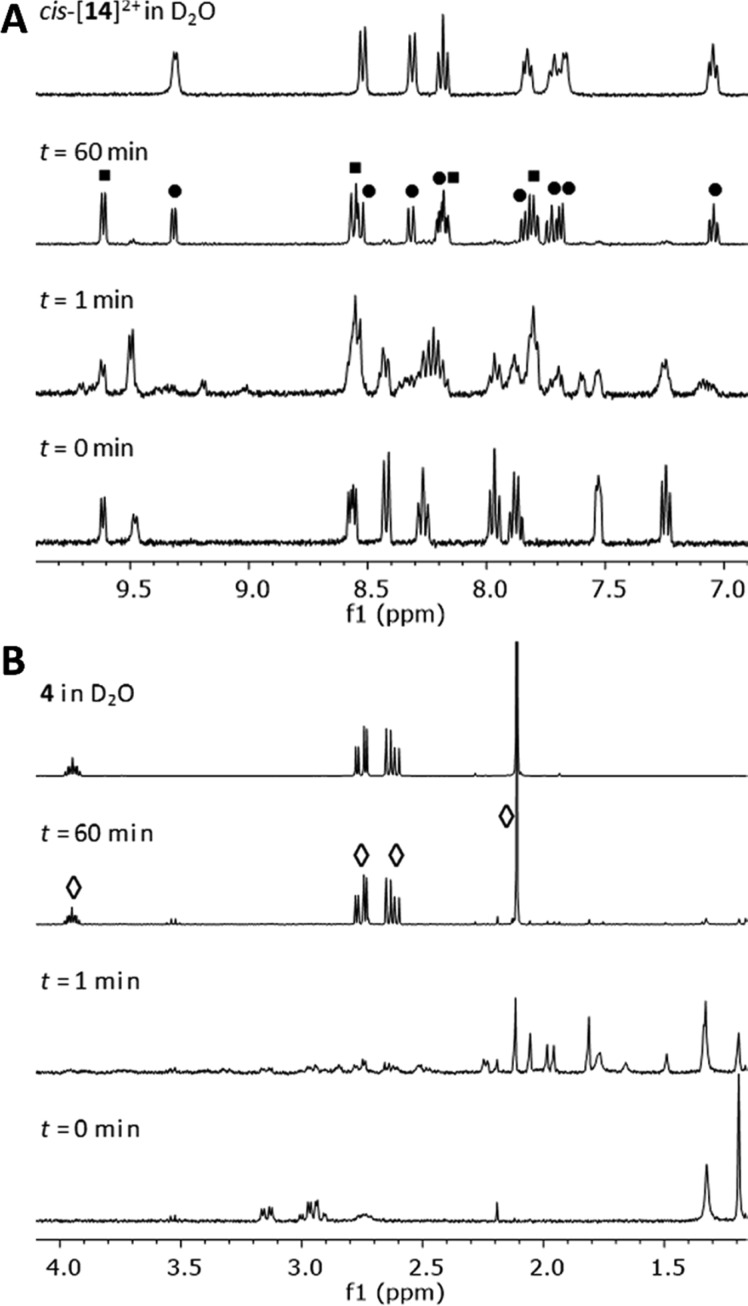
Figure 3.
Evolution of the aromatic (A, δ 9.9–6.9 ppm) and aliphatic regions (B, δ 4.1–1.15 ppm) of the 1H NMR spectrum of a solution of [1](PF6)2 (2.0 mM) in D2O upon irradiation with a Xe lamp (λirr = 400–700 nm) for 60 min. Labeled signals correspond to the free ligand 4 (diamonds), cis-[14]2+ (circles), and trans-[14]2+ (squares).

