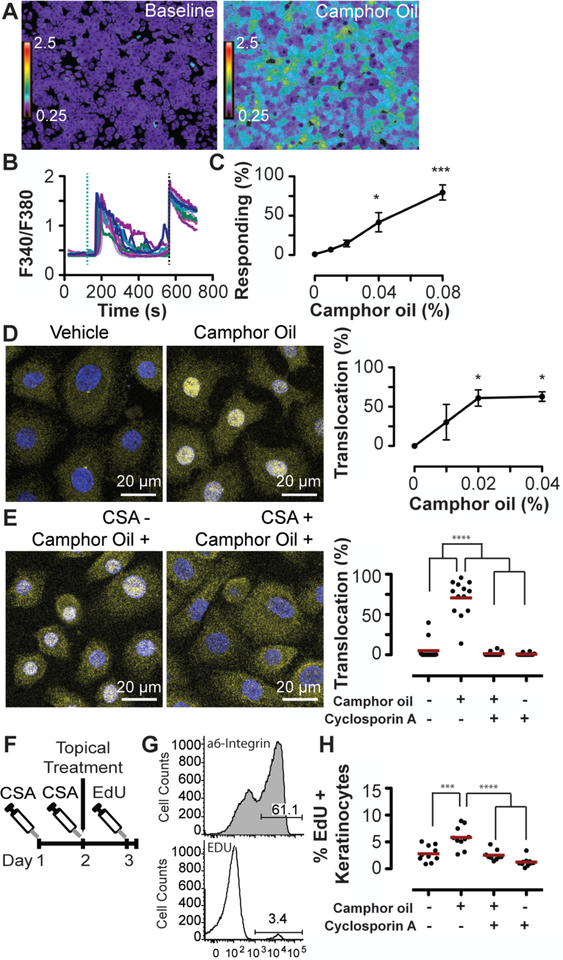
Fig. 2. CWO induces keratinocyte proliferation dependent on calcium/calcineurin.
CWO induced calcium signaling in human epidermal keratinocytes in vitro (A–C).
A. Keratinocytes before and after 0.04% CWO application.
B. Calcium transients with 0.04% CWO application. Teal dashed line indicates CWO application, black dashed line indicates positive control (histamine).
C. Percent of cells responding to CWO: 0.04–0.08% CWO significantly induced calcium responses (N=7–10 experiments/group from four individual keratinocyte donors P<0.0001, One-way ANOVA, Bonferroni’s post-hoc comparison with DMSO vehicle (Veh).
D. Cytosolic and nuclear localization of NFAT (yellow) and DAPI (blue) with 0% and 0.02% CWO. (Right) Percent of keratinocytes with nuclear NFAT localization following incubation with 0–0.04% CWO (N=3 experiments with >1200 cells per replicate; P<0.05 One-way ANOVA, Bonferroni’s post-hoc comparison with Veh).
E. Cells were pre-treated for 1 h with CSA or vehicle followed by a 30-minute treatment with 0.04% CWO or vehicle. NFAT localization after incubation with Veh/Veh, Veh/0.04% CWO (Left), 1 μM CSA/0.04% CWO, and 1 μM CSA/Veh (Right). Two-way ANOVA found a significant effect of CWO (P<0.0001) and CSA (P<0.001). Bonferroni post-hoc comparison revealed a significant difference between Veh/Veh and Veh/CWO samples that was abolished with CSA pre-treatment. N=10–11 experiments/group. One statistical outlier (as determined by Grubb’s test) was removed from both CSA/V and CSA/CWO groups.
F. Mice were treated 2x with CSA or Veh every 24 h followed by one application of CWO or Veh. 23 h later, mice were given a single injection of EdU. After a 1 h, keratinocytes were collected.
G. Representative flow gates. The percentage of EdU+ basal keratinocytes (α6-integrin+) were quantified.
H. CWO induced a significant increase in basal keratinocyte proliferation. Two-way ANOVA PCSA<0.001, PCWO<0.0001. Bonferonni post hoc analysis revealed a significant difference between Veh/CWO and Veh/Veh treatment groups, which was abolished by CSA pre-treatment. N=9–10 animals/group, one statistical outlier was removed from the CSA/CO group.
* P<0.05, *** P<0.001, ****P<0.0001, Red lines indicate group mean values.

