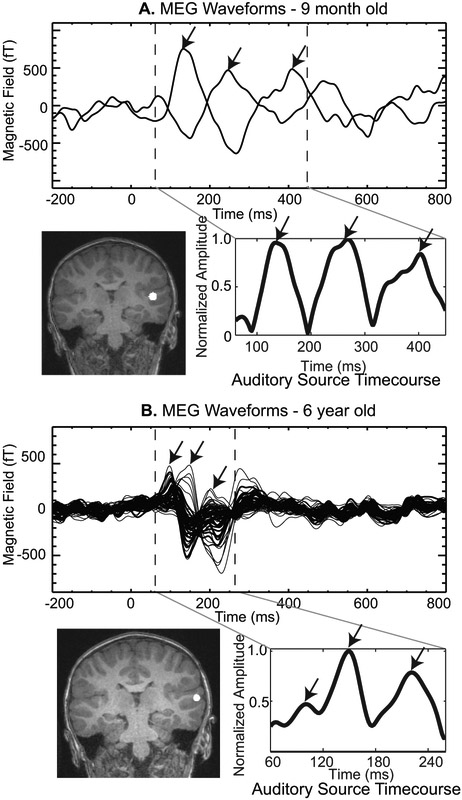
Figure 3. Example source analysis of the 1st three peaks.
A. The MEG waveforms for a 9 month old child are shown above with the three peaks identified by arrows and the time interval for source analysis denoted by the vertical dashed lines. Below left is the location of the auditory source projected onto a template child’s MRI. The auditory source timecourse is shown to the right with all three peaks clearly delineated in this auditory source timecourse. B. The MEG waveforms, source location and auditory source timecourse are shown for a 6 year old child also run in this same protocol. Notice the smaller time window used for the source analysis to capture the first three peaks in the older child. The same template child MRI was used to display the source location.

