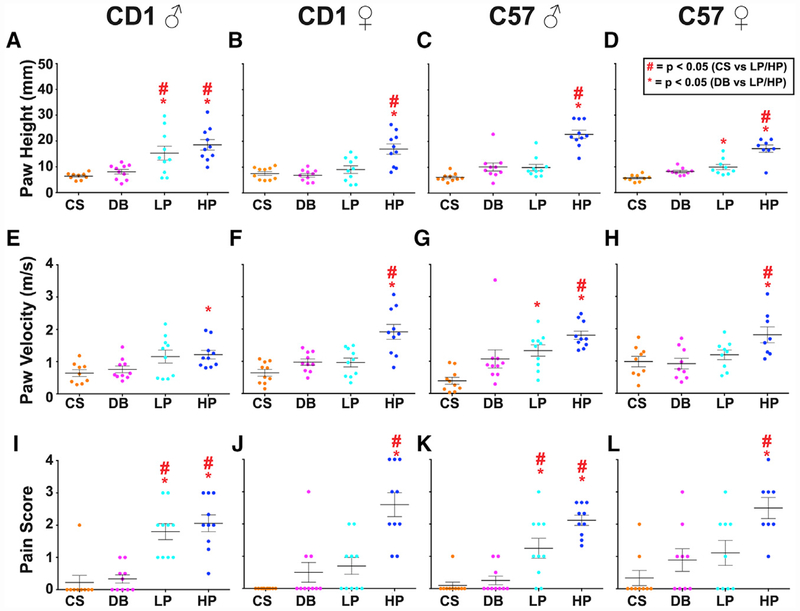
Figure 2. Quantification of the Three Behavior Parameters Showing Statistical Differences between Innocuous and Noxious Stimuli.
Each dot represents a given trial. Statistical significance between stimuli is determined using one-way ANOVA followed by Tukey’s multiple comparison test. Red stars represent p values < 0.05 when comparing CS with LP or CS with HP (LP or HP > CS), while red asterisks represent p values < 0.05 when comparing DB with LP or DB with HP (LP or HP > DB). Error bars represent SEM, and the longest horizontal line represents the mean.
(A–D) The maximum height of the first paw raise of the stimulated paw in CD1 males (A), CD1 females (B), C57 males (C), and C57 females (D).
(E–H) The paw velocity of the first paw raise of the stimulated paw in CD1 males (E), CD1 females (F), C57 males (G), and C57 females (H).
(I–L) The pain score for a given animal to each stimulus in CD1 males (I), CD1 females (J), C57 males (K), and C57 females (L). The pain score is a composite measurement of orbital tightening, jumping, paw shaking, and paw guarding.
Genotype and sex are indicated at top of each column; n = 10 animals for all groups.

