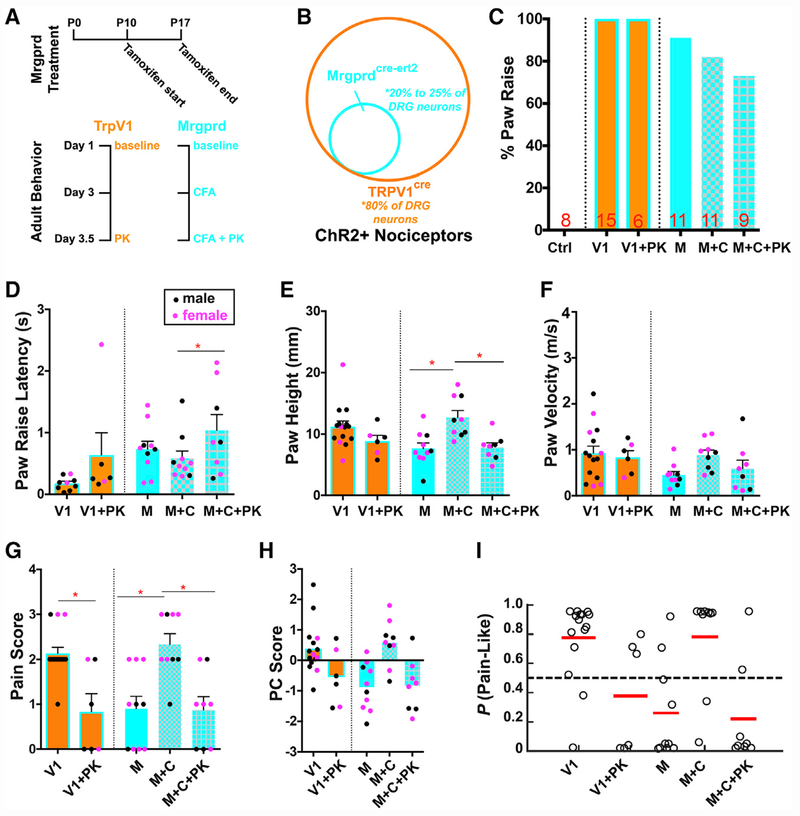
Figure 6. Optogenetic Activation of TRPV1-ChR2+ and MRGPRD+ Primary Afferents.
(A) Diagram of treatment paradigm and experimental design for paw reflexive behavior assays with Trpv1-ChR2 mice (orange) and Mrgprd-ChR2 (blue) mice.
(B) Graphical representation of the nociceptor populations targeted in Trpv1-ChR2 and Mrgprd-ChR2 mice.
(C) Percentage of animals displaying paw raise. “Ctrl” indicates ChR2f/f littermate control (n = 8 animals). “V” indicates Trpv1-ChR2 mice at baseline (n = 15 animals), and “V+PK” indicates Trpv1-ChR2 mice treated with painkiller (n = 6 animals). “M” indicates Mrgprd-ChR2 mice at baseline (n = 11 animals), “M+C” indicates Mrgprd-ChR2 mice at 3 days post-CFA (n = 11 animals), and “M+C+PK” indicates Mrgprd-ChR2 mice receiving painkiller at 3.5 days after CFA injection (n = 9 animals).
(D) Latency between blue light stimulation and paw raise.
(E–G) quantification for paw height (E), paw velocity (F), and pain score (G).
(H) PC scores of Trpv1-ChR2 and Mrgprd-ChR2 mice at baseline, after CFA, and CFA + painkillers using eigenvectors derived from wild-type mice of both sexes and genotypes. Trials with female mice indicated as pink dots and males as black dots.
(I) SVM pain-probability graphs using all wild-type mice of both sexes and genotypes as training datasets to predict the probability of a pain response for Trpv1-ChR2 and Mrgprd-ChR2 optogenetic responses in baseline, after CFA, and CFA + painkillers.

