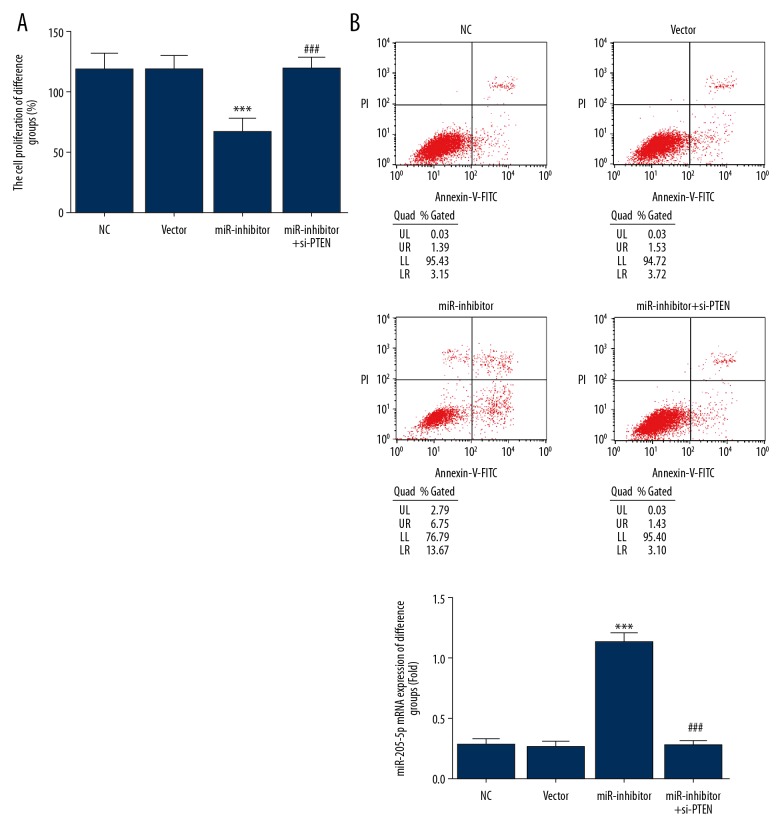
Figure 3.
Cell proliferation and apoptosis in human gastric cancer cell lines. (A)Cell proliferation rates in different cell groups assessed by the MTT assay. *** P<0.001 compared with the normal control (NC) group; ### P<0.001 compared with miR-inhibitor group. (B) Cell apoptosis rates of different groups assessed by flow cytometry. *** P<0.001 compared with the NC group; ### P<0.001 compared with the miR-inhibitor group.

