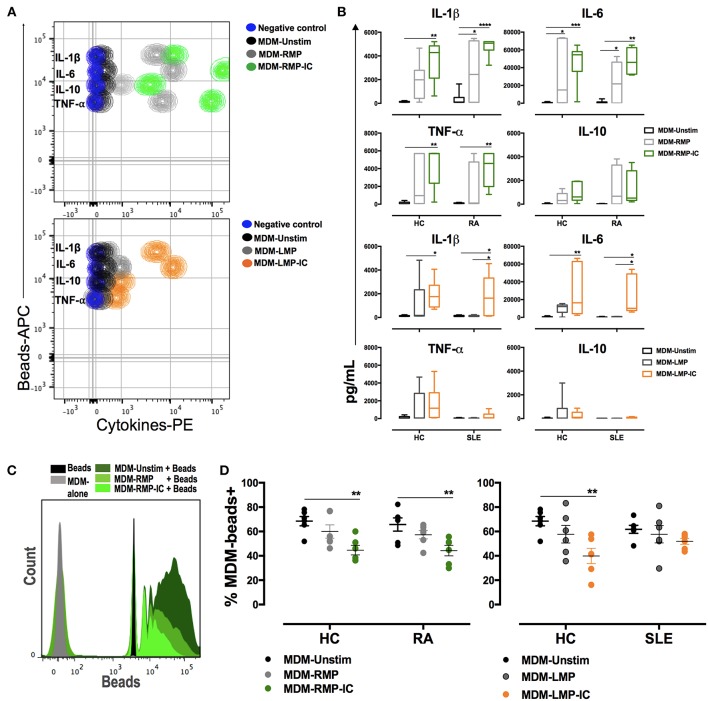
Figure 2.
MP and MP-IC induce the polarization of MDM toward a proinflammatory profile compatible with M1 activation and decrease the frequency of macrophages that phagocytose. (A) Top, CBA representative contour plot of cytokine levels in the supernatants of MDM from patients with RA differentiated without (Unstim, black contour plot) or with RMP (light gray contour plot) and RMP-IC (green contour plot). Below, a CBA representative contour plot of cytokine levels in the supernatants of MDM from patient with SLE differentiated without (Unstim, black contour plot) or with LMP (dark gray contour plot) and LMP-IC (orange contour plot). In both plots, the negative control (CBA beads alone) is shown as a blue contour plot. (B) The first two panels, cytokine levels in the supernatants of MDM from patients with RA (n = 6) and HC (n = 6) differentiated without (Unstim, black bar graph) or with RMP (light gray bar graph) and RMP-IC (green bar graph). The last two panels, cytokine levels in supernatants of MDM from patients with SLE (n = 6) and HC (n = 6) that were differentiated without (Unstim, black bar graph) or with LMP (dark gray bar graph) and LMP-IC (orange bar graph). (C) Representative histograms of latex beads alone (black); MDM from RA patients differentiated in absence of extracellular vesicles and incubated with fluorescent latex beads (Unstim, dark gray histogram) and MDM differentiated with RMP (medium green histogram) or RMP-IC (light green histogram) and incubated with fluorescent latex beads. (D) Left, the frequency of MDM from HC (n = 6) and patients with RA (n = 6) that bound/internalized fluorescent latex beads after these cells were differentiated without (Unstim, black dots) or with RMP (light gray dots) and RMP-IC (green dots). Right, the frequency of MDM from HC (n = 6) and patients with SLE (n = 6) that bound/internalized fluorescent latex beads after these cells were differentiated without (Unstim, black dots) or with LMP (dark gray dots) or LMP-IC (orange dots). Comparisons among the groups were performed using ANOVA II and the Bonferroni post-hoc test.

