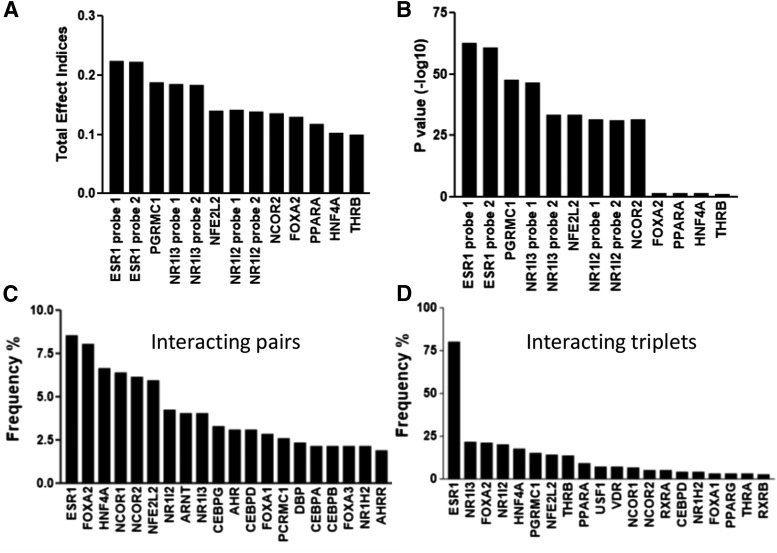
Fig. 1.
Influence of the top-scoring liver-enriched transcription factors (from a total of 45 selected TFs) obtained from SSI analysis, using microarray gene expression data from 427 livers. (A and B) Results from the first-order analysis, total effect indices (A) and P value (B). (C and D) Results from the higher order analysis, frequencies of TFs appearing in the top 1000 interacting pairs (C) and triplets (D). TFs measured by more than one microarray probe yielded similar results.

