Figure 2.
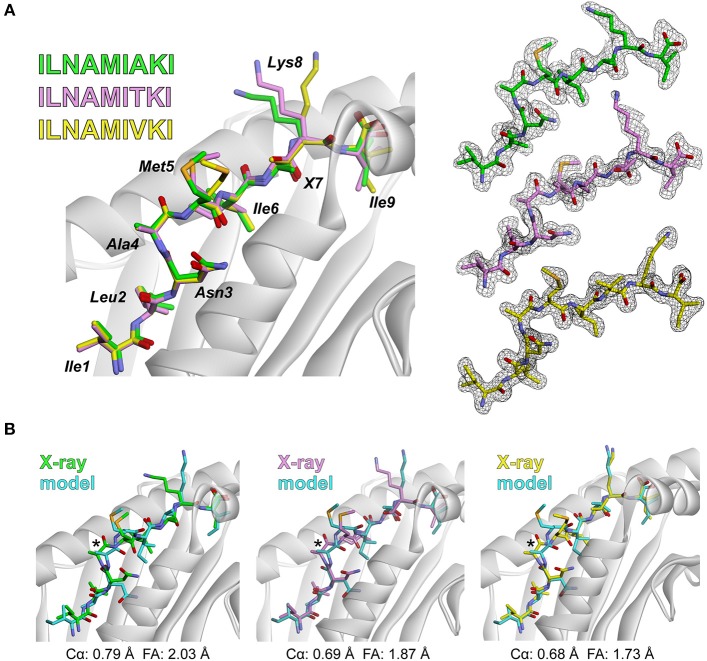
Experimental test of the peptide/MHC modeling strategy. (A) Structures of the ILNAMIAKI, ILNAMITKI, and ILNAMIVKI peptides in the binding groove of HLA-A2 as determined by X-ray crystallography. The peptides are colored green, pink, or yellow as indicated; this color scheme is maintained throughout the figure. The left panel shows all three structures superimposed. Peptide amino acids are indicated, with “X” used to indicate the various amino acids at position 7. The right panel shows 2Fo-Fc electron density maps contoured at 1σ for peptides from each peptide/HLA-A2 structure. (B) Comparison of the models of each peptide/HLA-A2 complex with the crystallographic structures. For each panel, the backbone at Ala4 is highlighted with an asterisk and the Cα and full atom (FA) RMSD values for each structure/model pair are indicated.

