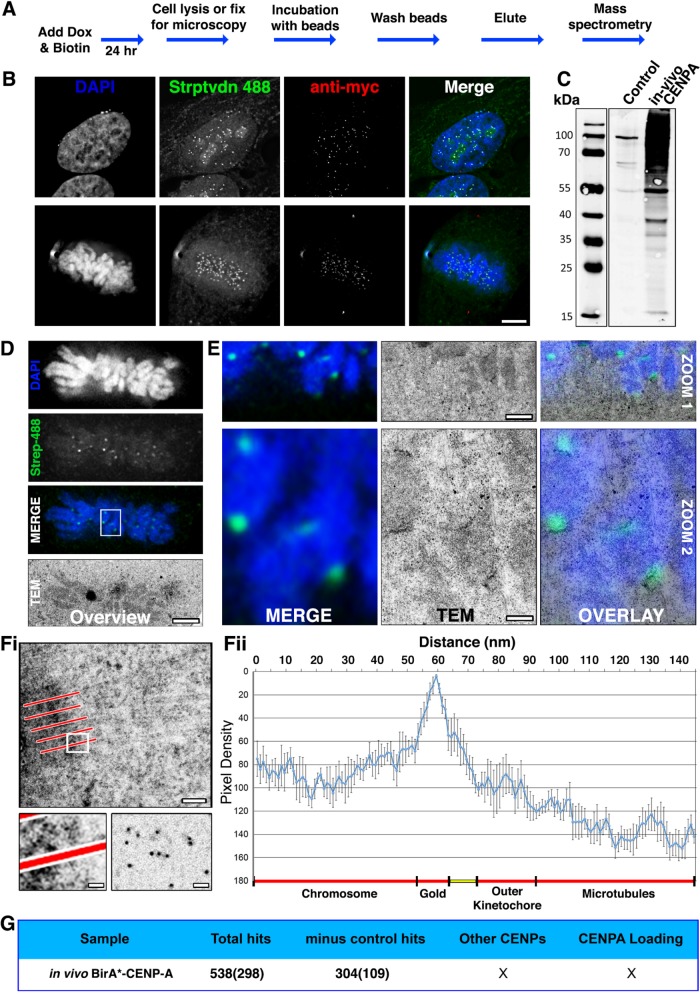
FIGURE 1:
Testing in vivo BioID using CENP-A. (A) Flowchart describing how HeLa tet-on cells, stable for the conditional expression of myc-BirA*CENP-A (BirA*–CENP-A), were cultured in media supplemented with doxycycline and 50 µm biotin for 24 h before processing for either microscopy or mass spectrometry. (B) Cells fixed and processed for immunofluorescence. The panels show representative examples of cells in interphase and mitosis probed with streptavidin 488 (green), anti-myc (red), and stained with DAPI (blue). (C) Immunoblot analysis of affinity-purified material from control (parental HeLa cell line) or BirA*–CENP-A expressing cells. Blots were probed with streptavidin 800 IR LI-COR labels. (D–F) HeLa cells were seeded into CLEM dishes and cell culture media was supplemented with doxycycline and 50 μm biotin for 24 h. Cells were fixed, permeabilized, and probed with Alexa Fluor 488 dye–labeled colloidal gold, conjugated to streptavidin (Molecular Probes), and imaged using LM to identify mitotic cells of interest. Cells were embedded in resin, sectioned, and imaged by transmission electron microscopy (TEM). (D) Low-magnification images showing the metaphase plate of mitotic cell chosen for CLEM. Images are DAPI (blue), regions of biotinylation (green), and the same cell reidentified by TEM. (E) Two progressive zooms of the boxed region shown in D, shown as LM merge (left), TEM (middle), and LM-TEM merge (overlay, right). Bottom panels (Zoom 2) show 9× magnifications of the white box in D. Top panels (Zoom 1) are a 3× magnification intermediate of part of the white box in D. Contrast-rich areas are visible corresponding to centromeres. The scale bar shows 100 nm (top) and 20 nm (bottom). (F) Pixel density analysis. Line scans (five to six per kinetochore—indicated in panel Fi, top) were taken through kinetochores, originating in the centromere and terminating in the cytoplasm, among kinetochore microtubules. The bottom left panel is an enlargement of the white box in Fi, showing a representative line scan passing through the kinetochore and terminating in the cytoplasm. The bottom right panel shows gold particles only, spotted onto a carbon film for comparison. Pixel densities were compiled and represented as a histogram (Fii). Predicted subcellular positions are noted beneath the histogram. Ncell = 2. Nkinetochore = 12. Bar = 20 nm. (G) Summary of the MS data returned for in vivo BirA*–CENP-A. Numbers in brackets represent the ranked position of CENP-A within the MS data, based on protein score.

