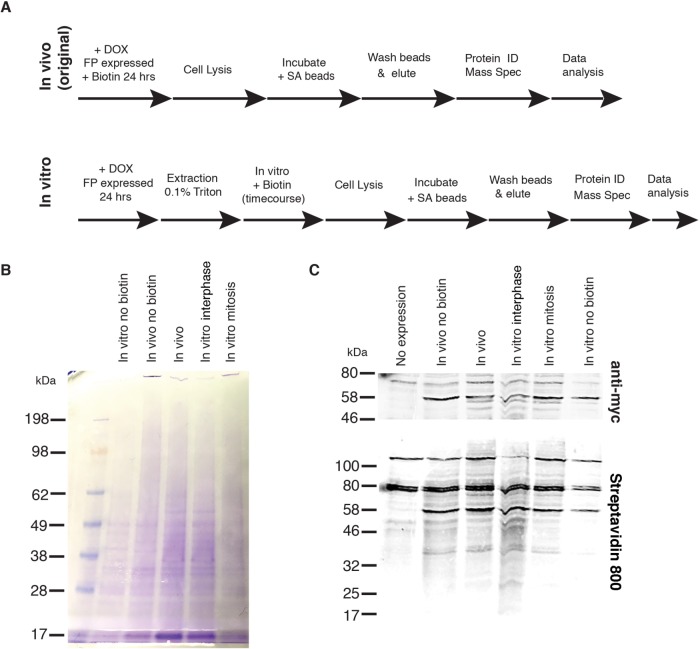
FIGURE 4:
Production of samples for ivBioID analysis of CENP-A. (A) Comparison of original in vivo BioID (top) and in vitro BioID (bottom) methodologies showing addition of the permeabilization step and post lysis biotinylation. (B) Coomassie blue stain gel of samples submitted for MS showing controls and hit samples. (C) Western blot of samples submitted for MS showing controls and hit samples. Biotinylation can be seen in the bottom panel, and anti-myc–BirA*–CENP-A can be seen in the top panel.

