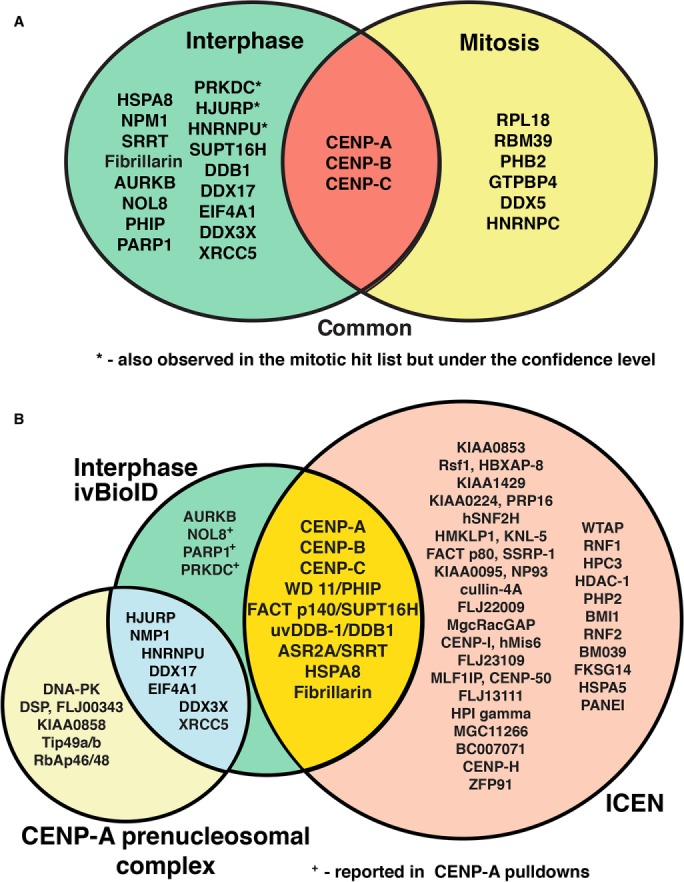
FIGURE 5:

Analysis of the CENP-A neighborhood in interphase and mitosis using ivBioID. (A) Venn diagram showing the final filtered hit lists for interphase (green) and mitotic (yellow) samples and how they overlap with one another. Interphase hits labeled with * were also observed in the mitotic hit list but were under the confidence level. The overlap in red shows those proteins seen in both interphase and mitotic lists. (B) Proteins observed in the interphase ivBioID final hit list (green) show overlap with known CENP-A interacting proteins. The bulk of the proteins detected by ivBioID correspond to proteins previously found in the ICEN complex (yellow overlap; Ando et al., 2002; Obuse et al., 2004; Izuta et al., 2006) and the CENP-A prenucleosomal complex (blue overlap; Foltz et al., 2006). The other proteins not detected in our analysis but found in the original descriptions of the ICEN complex (orange) and CENP-A prenucleosomal complex (pale yellow) are also shown. Hits labeled with + were previously found in pull downs using either CENP-A or themselves as the target.
