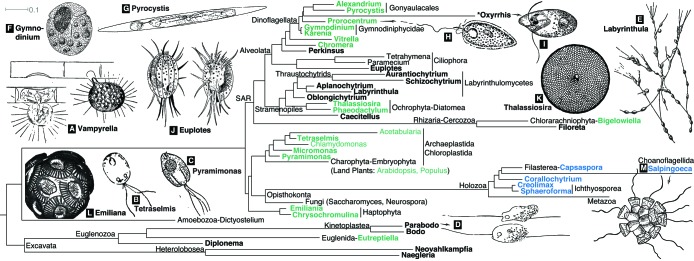
FIGURE 1:
Overview of approximate phylogenetic relationships among developing marine protist models and established freshwater model systems, displayed at the genus level, as well as illustrations of select marine protists. On the phylogeny, marine protists are in bold, with marine models used to explore multicellularity and photosynthesis in blue and green, respectively. We include a subset of genera from Waller et al. (2018) as well as additional cases to highlight lineages discussed herein; see Supplemental Table 1 for a complete list. Small subunit rRNA alignment r132 from SILVA (Quast et al., 2012) was used in IQ-TREE (Schmidt et al., 2014) to produce the phylogeny, including an archaeal outgroup. Scale bar indicates average number of substitutions per site. Some lineages were rearranged in TreeGraph (Stöver and Müller, 2010) to reflect literature consensus. Drawings A–M (not to scale) are adapted from the following sources: Tetraselmis (Stokes, 1888), Pyramimonas and Pyrocystis (West, 1916), and Prorocentrum (Calkins, 1926). Emiliana huxleyi is adapted from a scanning electron micrograph image (CC BY 2.5; Taylor, 2011). Thalassiosira is adapted from microphotos of a fossil prepared by Anne Gleich (CC BY 2.0; Picturepest). The Salpingoeca rosetta colony is redrawn from a microscope image (CC BY-SA 3.0; Mark Dayel; redrawn by Tiago Pratas). Labyrinthula cells are illustrated (E) moving along the shared ectoplasmic network (Moore, 1911). Not shown on the phylogeny, Vampyrella is illustrated (A) boring into and sucking out (left) and completely emptying (right) a Spirogyra cell (Verworn, 1899, p. 148). All other drawings were adapted from Calkins (1901).

