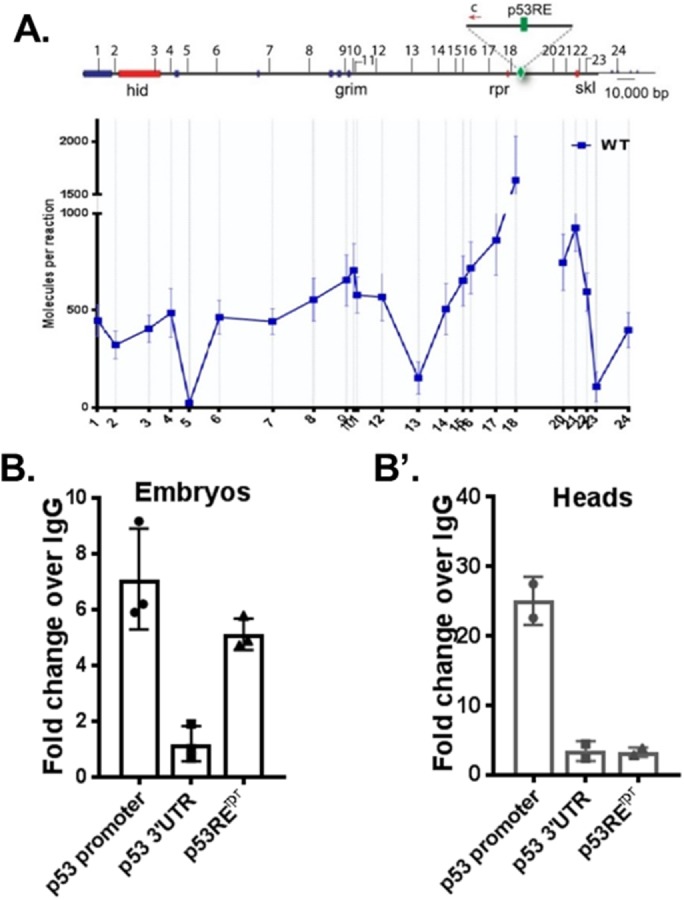
FIGURE 2:

p53 binding at the rpr enhancer is lost in postmitotic tissue. (A) 3C-ddPCR experiments in Drosophila head tissue. Interactions between the p53RErpr (green) and IR induced cell death p53 targets (red) were measured. Note that the p53RErpr looping pattern is very similar to published patterns from embryos (Link et al., 2013). B and B’ show ChIP-ddPCR experiments measuring p53 occupancy at the p53RErpr in embryo and head tissue. Note that patterns were reproduced using ChIP-seq (Figure 4). Positive and negative control regions corresponding to the p53 promoter and p53 3′UTR were included (Merlo et al., 2014). Values represent fold change over immunoprecipitation using IgG. Mean values represented with SD, (A) n = 3, (B) n = 2 (see ChIP methods).
