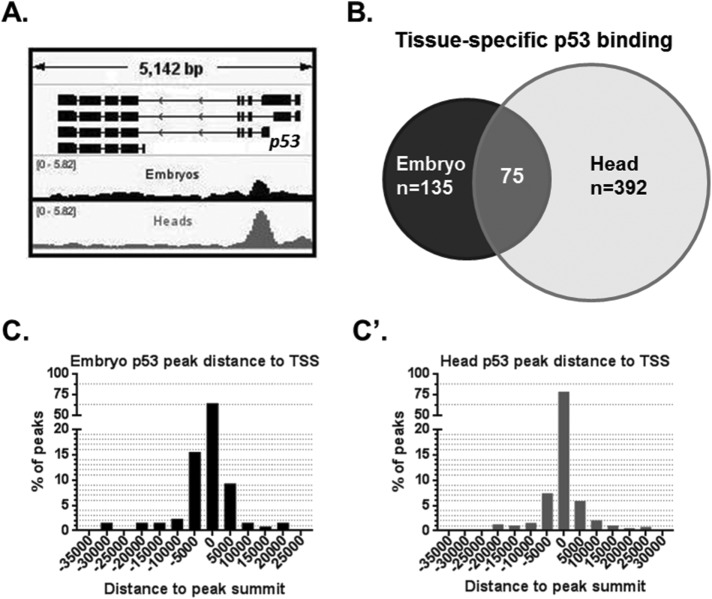
FIGURE 3:
p53 genome-wide binding profiles in Drosophila embryos and heads. (A) ChIP-seq detects a published p53-enriched region at the promoter of p53 gene (Merlo et al., 2014). Graph displays fold enrichment over p53−/− samples (for normalized tracks including the p53−/− see Supplemental Figure S3). (B) Venn diagram of ChIP-seq p53 called peaks shared and distinct among the indicated tissues. (C, C’) Distribution of p53 peaks by distance between the peak and the closest TSS (C in embryos and C’ in heads).

