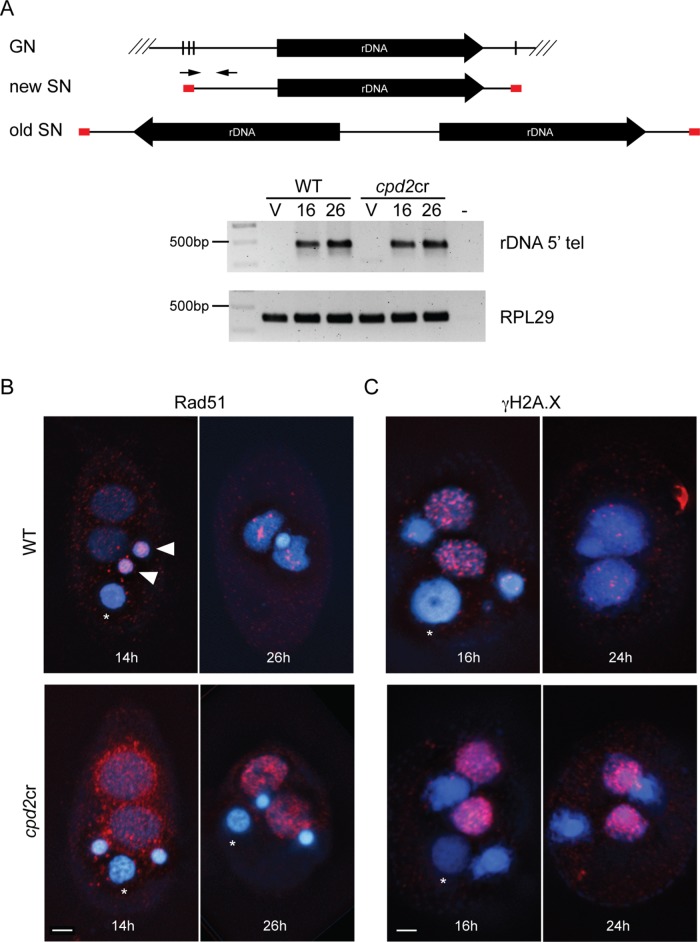
FIGURE 8:
New SN in cpd2cr cells show signs of DNA lesions. (A) PCR analysis of chromosome breakage at the rDNA chromosome shows normal breakage and telomere addition in cpd2cr cells. Diagrams show the germline and somatic rDNA forms in old and new SNs. Primers (arrows) corresponding to rDNA telomere sequence (red boxes) and the 5′ upstream region only amplify rDNA in the new SN, which is formed directly after cleavage and telomere addition. DNA samples were made from WT or cpd2cr vegetative (V) or mating cells at 16 and 24 h after initiation of mating. The new rDNA form was amplified from DNA samples from both WT and mutant mating cells, but not from vegetative cells. (B) Abnormal Rad51 (red) accumulated in developing SN of cpd2cr cells at 14 and 26 h after initiation of mating. Asterisks indicate the degrading parental nucleus; closed arrowheads indicate germline Rad51 staining at the 14 h time point. (C) The γH2A.X signal (red) was stronger at 16 h in cpd2cr than in WT cells and persisted to 24 h (when it was mostly lost in WT cells). Scale bars, 5 μm.

