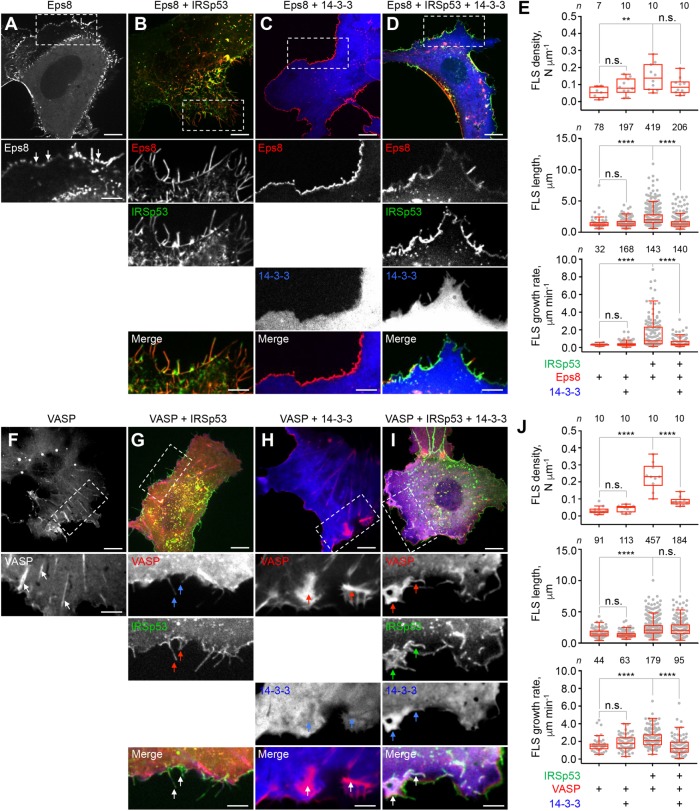
FIGURE 2:
14-3-3 Inhibits IRSp53, EPS8, and VASP-induced FLS in live cells. (A–D) Serum-starved COS-7 cells coexpressing GFP-Eps8 with IRSp53-mTagBFP2 or mCherry-14-3-3 (individually or together). Arrows point to examples of IRSp53, Eps8, and 14-3-3 localization to cell protrusions. Scale bars throughout this figure represent 10 and 5 μm in whole-cell and inset images, respectively. (E) Quantification of the density, length, and growth rate of FLS. The statistical significance of the measurements was determined using the Mann–Whitney rank sum test, based on the indicated number of observations (n) reordered from 7–10 cells and two independent transfections (n.s., nonsignificant; **p < 0.01; ****p < 0.0001). (F–I) Serum-starved COS-7 cells coexpressing GFP-VASP with IRSp53-mTagBFP2 or mCherry-14-3-3 (individually or together). Arrows point to examples of VASP, IRSp53 and 14-3-3 localization. Notice that the density of 14-3-3 drops in VASP-enriched areas (H), whereas 14-3-3 is enriched in areas positive for both IRSp53 and VASP (I). (J) Quantification of the density, length, and growth rate of FLS. The statistical significance of the measurements was determined using the Mann–Whitney rank sum test, based on the indicated number of observations (n) reordered from 7–10 cells and two independent transfections (n.s., nonsignificant; ****p < 0.0001).

