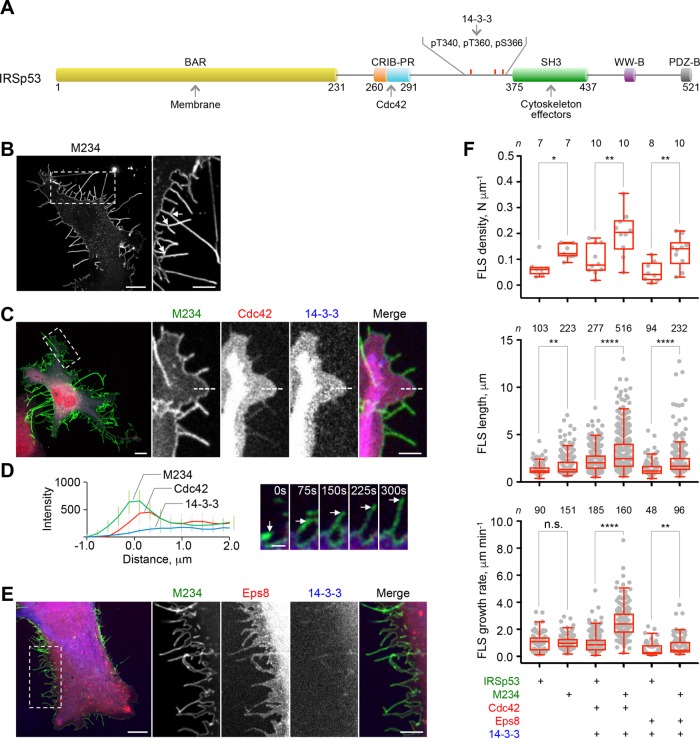
FIGURE 4:
Phosphoinhibitory mutations in IRSp53 abrogate 14-3-3-dependent inhibition of FLS dynamics. (A) Domain diagram of IRSp53 showing the three residues that on phosphorylation mediate the binding of 14-3-3 and which were mutated to alanine in mutant M234 (B) COS-7 cell expressing M234-GFP (IRSp53 mutant T340A/T360A/S366A). Scale bars throughout this figure represent 10 and 5 μm in whole-cell and inset images, respectively. (C) COS-7 cell expressing M234-GFP, RFP-Cdc42, and mTagBFP2-14-3-3. (D) Average fluorescence intensities from 10 line scans across the cell edge (as exemplified by dashed lines in the insets in C) and a representative time series of a growing FLS (indicated by arrows). Scale bar represents 5 μm. (E) COS-7 cell expressing M234-GFP, mCherry-Eps8 and mTagBFP2-14-3-3. (F) Quantification of the density, length, and growth rate of FLS. The statistical significance of the measurements was determined using the Mann–Whitney rank sum test, based on the indicated number of observations (n) recorded from 7–10 cells and two independent transfections (n.s., nonsignificant; *p < 0.05; **p < 0.01; ****p < 0.0001).

