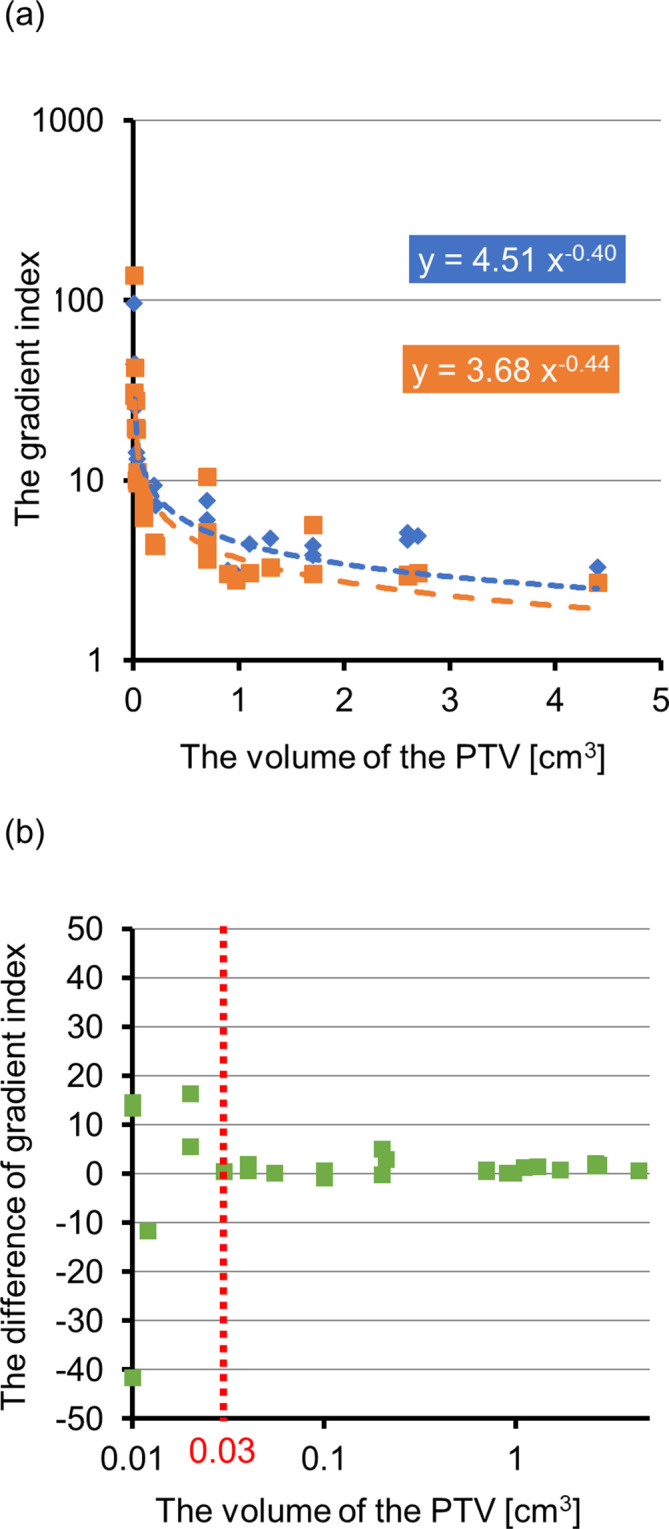
Figure 2.

(a) PTV according to GI. Blue represents CyberKnife, and orange represents HyperArc. GI is expressed in logarithmic scale. The GI for CyberKnife and HyperArc suitably fitting with the PTV. The dashed lines represent regression curves. (b) The relationships between PTV and the differences. The volume of the PTV is expressed in logarithmic scale. The red dotted line represents X coordinate of 0.03. GI, gradient index; PTV, planning target volume.
