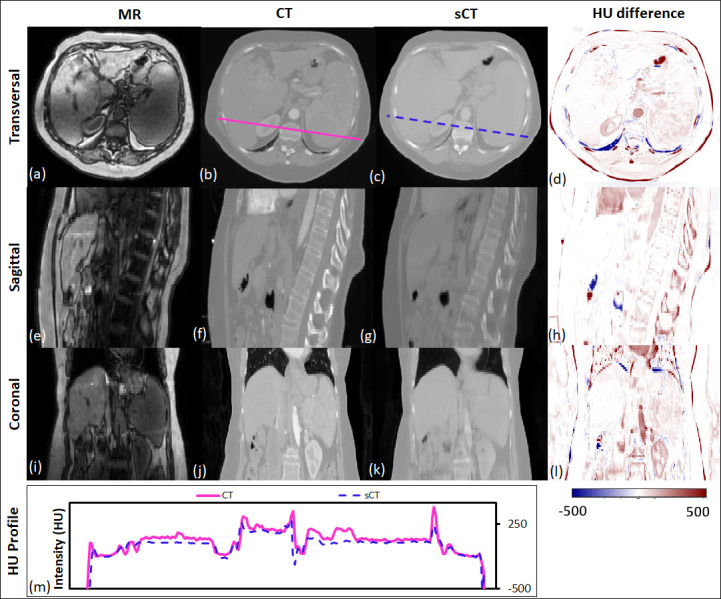
Figure 2.

The transverse, sagittal, and coronal images of a representative patient. MR, CT and sCT images and the HU difference between CT and sCT are presented. The CT and sCT voxel-based HU profiles are shown at the bottom, to demonstrate the HU values highlighted in the solid and dash line in the transverse images. HU, Hounsfield unit; sCT, synthetic CT.
