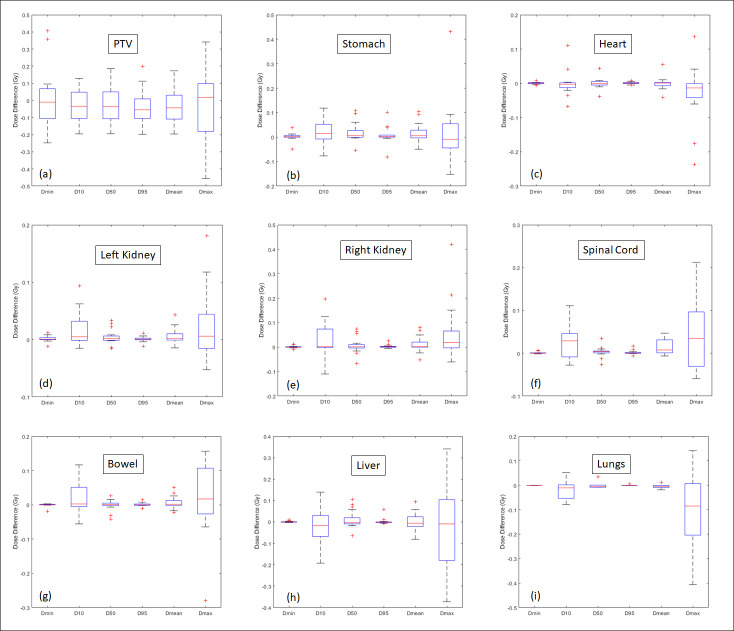
Figure 6.
Box plot of absolute difference between sCT and CT for Dmin, D10, D50, Dmean and Dmax for the PTV and OARs. The central red line indicates the median value, and the borders of the box represent the 25th and 75th percentiles. The outliers are plotted by the red “+” marker. OAR, organ at risk; PTV, planning target volume; sCT, synthetic CT.

