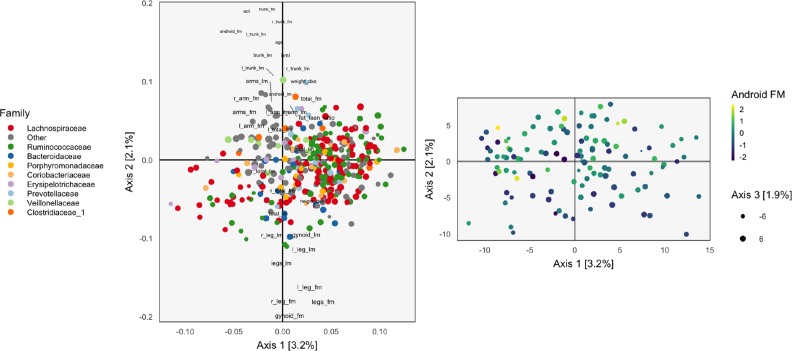
Figure 1.
The loadings (left) and scores (right) obtained by applying Principal Components Analysis (PCA) to the combined body composition and microbial abundance data. For the loadings, species are points, and are shaded in by taxonomic family. Body composition variables are plotted as text. The size of points and words measures the contribution of the third PC dimension. For scores, each point corresponds to a sample.

