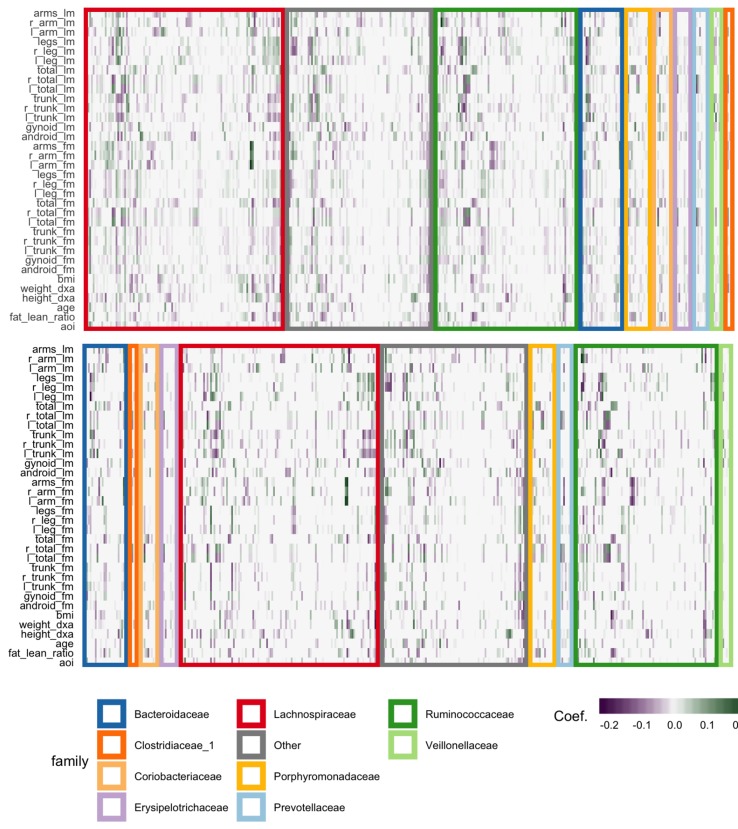
Figure 12.
Coefficients for the graph-fused (top) and decoupled (bottom) lasso fits highlight groups of species with similar profiles across response variables. Colored rectangles demarcate taxonomic families. Individual cells give the coefficient for a particular species (column) for a given response variable (row). Purple and green denote negative and positive coefficients, respectively. Note that coefficient graph-fused panels have been smoothed according to correlation network between variables, as given in Figure 11 . Species with similar coefficients are placed near one another. Note that even in the decoupled case, where there is no sharing across response problems, the coefficients nonetheless seem to be similar within lean and fat mass response groups, respectively. However, they are not as smooth as in the graph-fused lasso. As there is some consistency within these groups of variables, the form of structured regularization imposed by the graph seems appropriate.

