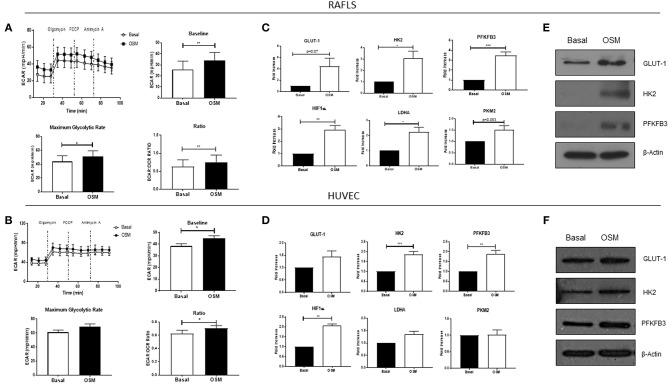
Figure 2.
OSM induces glycolytic mechanisms in in RAFLS and HUVEC. Average seahorse profiles demonstrating extracellular acidification rate (ECAR) (glycolysis) in (A) RAFLS (n = 8) and (B) HUVEC (n = 4), before and after injections of oligomycin, FCCP, and antimycin A following 3 h OSM (10 ng/ml) stimulation. Representative bar graphs demonstrating baseline ECAR, maximal glycolytic rate and ECAR:OCR ratio in (A) RAFLS and (B) HUVEC. Representative bar graphs demonstrating mRNA expression of glucose transporter 1 (GLUT-1), hexokinase 2 (HK2), 6-phosphofructo-2-kinase/fructose-2,6-biphosphatase 3 (PFKFB3), HIF1α, lactate dehydrogenase A (LDHA glucose transporter 1 and pyruvate kinase M2 (PKM2) in (C) RAFLS (n = 5–6) and (D) HUVEC (n = 4–8) treated with OSM (10 ng/ml) for 24 h. Fold increase compared to endogenous controls (RPLPO and HPRT1). Representative western blot showing GLUT-1, HK2, PFKFB3 in (E) RAFLS and (F) HUVEC, β-actin was used as loading control. Wilcoxon signed rank and paired t-test were used for RAFLS and HUVEC, respectively. Data expressed as mean ± SEM, *p < 0.05, **p < 0.01, ***p < 0.005 significantly different from basal.

