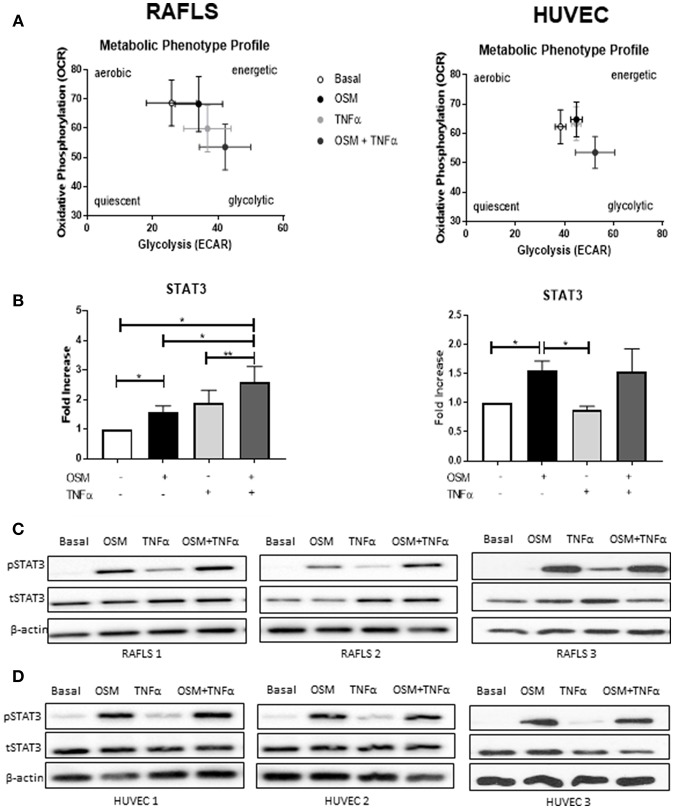
Figure 5.
OSM in combination TNFα regulates STAT3 expression in RAFLS. (A) Metabolic phenotype profiles in RAFLS and HUVEC representing changes in metabolic phenotype in response to OSM (10 ng/ml) and TNFα (1 ng/ml) alone and in combination. (B) Representative bar graphs demonstrating mRNA expression of STAT3 in RAFLS (n = 6) and HUVEC (n = 4) following treatment with OSM alone or in combination with TNFα for 24 h. Fold increase compared to endogenous controls (RPLPO and HPRT1), data analyzed using paired t-test. Data expressed as mean ± SEM, *p < 0.05, **p < 0.01. Representative western blot showing phospho-STAT3 (pSTAT3) and total-STAT3 (tSTAT3) in RAFLS (C) and HUVEC (D). β-actin was used as loading control.

