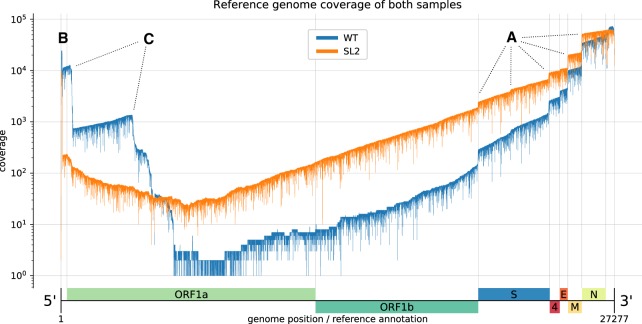
Figure 2.
Reference genome coverage of the HCoV-229E WT sample (blue) and the SL2 sample (orange) based on alignments with minimap2. There is an inverse correlation between sg RNA abundance and length. (A) Notable vertical “steps” in the coverage correspond to borders expected for the canonical sg RNAs (see Fig. 1). (B) The presence of the leader sequence (∼65 nt) in canonical sg RNAs gives rise to the sharp coverage peak at the 5′-end. (C) We also observed unexpected “steps,” especially in the WT sample (blue). We hypothesize that the sequences correspond to DI-RNA molecules that may arise by recombination at TRS-like sequence motifs as well as other sites displaying sequence similarities that are sufficient to support illegitimate recombination events (see Fig. 3). We attribute the difference in the observed (noncanonical) recombination sites between the two samples to biological factors that we either did not control for or do not know (see also legend to Fig. 3).

