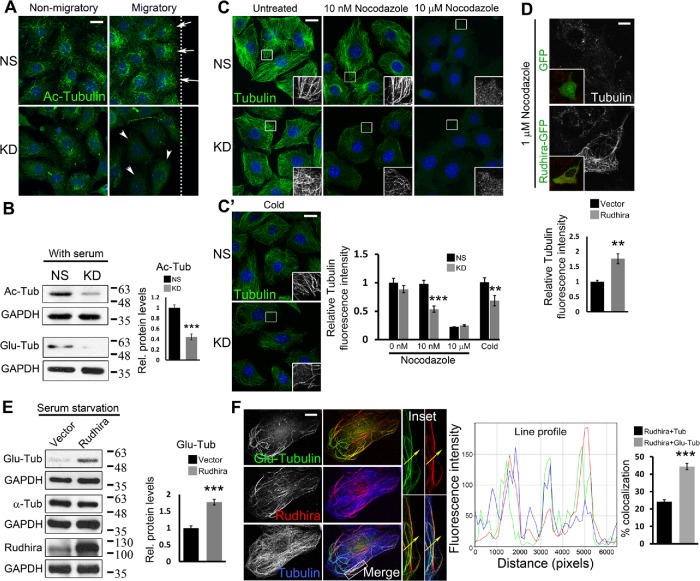
FIGURE 3:
Rudhira is essential for MT stability. (A) Levels and localization of Ac MTs were analyzed in NS and KD cells by immunostaining a scratch-wound healing assay. Arrows point to Ac MTs toward the leading edge and arrowheads to Ac MTs distributed all over the cell. The dotted line represents the wound margin. Migratory, adjacent to the wound; Nonmigratory, away from the wound. (B) Ac-tubulin, Glu-tubulin levels were analyzed by immunoblot. The graph shows the quantitation of relative Ac-tubulin levels. (C, C’) NS and KD cells were treated with the indicated dosages of nocodazole for 30 min (C) or cold PBS at 4°C (C’), and MTs were analyzed by immunostaining for β-tubulin. Boxed regions (C, C’) are magnified in the insets. The graph shows the quantitation of relative tubulin fluorescence intensity. (D) SVEC cells were transiently transfected with GFP or Rudhira-GFP (inset) and treated with nocodazole, and MTs were analyzed by immunostaining for tubulin. The graph shows the quantitation of relative tubulin fluorescence intensity (five transfected cells). (E) Immunoblot analysis for Glu-tubulin levels post-48 h serum starvation in HEK293 cells overexpressing Rudhira. The graph shows the quantitation of relative Glu-tubulin levels. (F) Relative localization of detyrosinated MTs (Glu-tubulin), Rudhira, and total MTs (tubulin) was performed by triple immunostaining in wild-type SVECs. The line profile shows the fluorescence intensity peaks for the three colors along the yellow arrow in the inset (magnified boxed region). The graph shows the percent overlap of Rudhira with tubulin or Glu-tubulin. Error bars indicate SEM. Results shown are a representative of three independent experiments. Statistical analysis was carried out using one-way ANOVA. Scale bar: (A, C, C’) 20 μm, (D) 5 μm, (F) 10 μm. **p < 0.01, ***p < 0.001.

