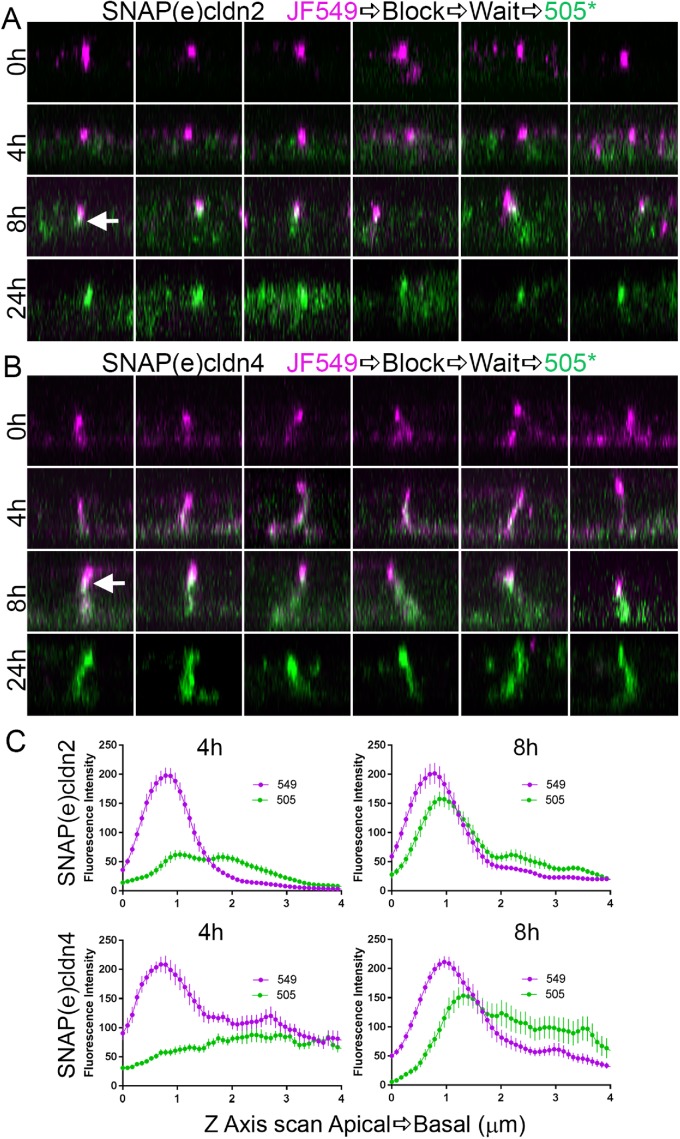
FIGURE 6:
Time course of z-axis analysis of SNAP(e)cldn2 (top panels) and SNAP(e)cldn4 (bottom panels) reveals that only new cldns replace old cldn by first trafficking first to the lateral membrane. Multiple isolated z-stack images of MDCK II cell lateral membranes show position of old cldn2 (A) and 4 (B) (0 h, magenta, top panels) that are gradually replaced with new (green) at 4, 8, and 24 h. Arrows indicate examples of overlap (white) between old, apical cldn (magenta) and newly synthesized cldn (green). (C) Line scans (N = 14) from the apical to the basal direction along the lateral cell membrane starting at the apicalmost fluorescent signal and extending basally for 4 µm show the apical shift of new cldn localization (top panels, cldn2; bottom panels, cldn4.

