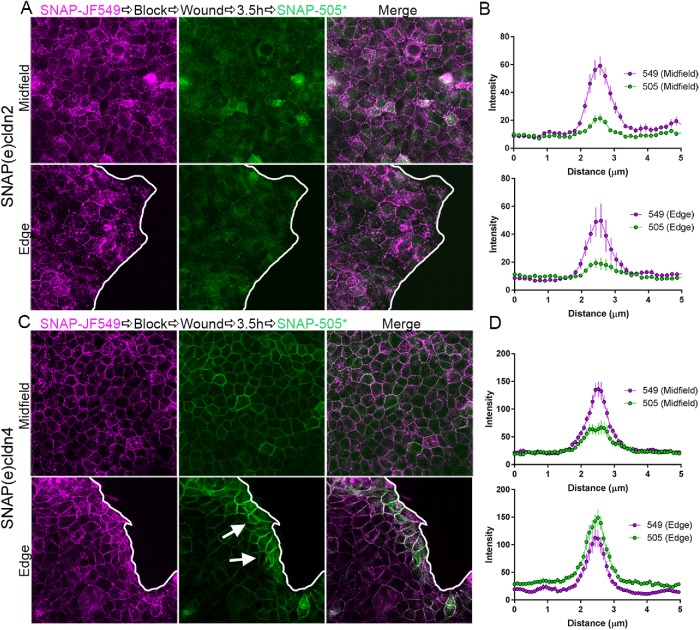
FIGURE 8:
Migrating cells accumulate newly synthesized cldn4 but not cldn2 at cell contacts. (A) MDCK II cells expressing SNAP(e)cldn2 were plated in chambers with silicon inserts. When cells reached confluence, they were incubated with JF549 SNAP-cell ligand, washed, and blocked. Gaskets were removed (wound) and cells allowed to migrate into the resulting cell-free area. SNAP-cell 505* was added 3.5 h later. Fluorescence imaging of both the middle of the cell field (top image) and at the edge (bottom image) revealed roughly equivalent amounts of SNAP cell 549 signal and lower, but again equivalent amounts of cell contact new 505*-labeled SNAP(e)cldn2; this distribution was quantified by line scanning in B. In contrast, the same protocol applied to SNAP(e)cldn4-expressing cells (C) revealed more localization of new 505*-labeled SNAP(e)cldn4 near the free edge (lower image) than in midfield (upper image); this distribution was quantified by line scanning in D.

