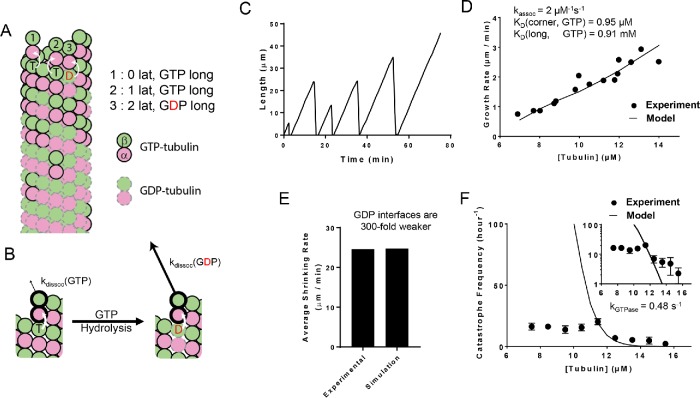
FIGURE 1:
Simulations of a two-state biochemical model for microtubule dynamics. (A) Cartoon representation of a typical growing MT tip during a simulation. αβ-tubulin dimers are represented as pink and green circles; solid black and dashed gray outlines indicate GTP and GDP states, respectively. Dissociation rates depend on the number of lateral neighbors and the identity of the nucleotide at the longitudinal interface (vertical white arrows indicate trans-acting nucleotides; see B). (B) Illustration of trans-acting nucleotide. αβ-tubulins with GTP at the longitudinal interface dissociate more slowly than αβ-tubulins with GDP at the longitudinal interface. (C) Representative plot showing simulated MT length vs time at 12 µM αβ-tubulin. The simulation parameters are listed elsewhere (see D, E). Catastrophes occur naturally as a consequence of the biochemical rules. (D) Comparison between measured (black circles) and predicted (line) growth rates. Experimental data are taken from Walker et al. (1988). (E) Comparison between measured and predicted shrinking rates. (F) Comparison between measured (black circles) and predicted (line) catastrophe frequencies at different αβ-tubulin concentrations. The two-state model cannot recapitulate the measured concentration dependence of the catastrophe frequency. The y-axis is linear in the larger plot. The smaller inset graph displays the same data, but the y-axis is on log scale.

