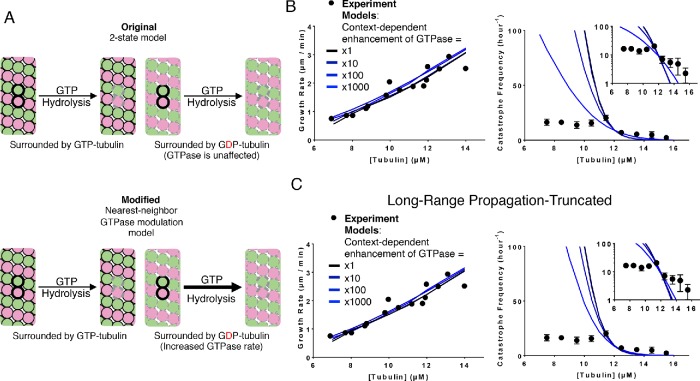
FIGURE 4:
Model that incorporates nearest-neighbor modulation of GTPase activity. (A) Cartoons illustrating the differences between models without (top) and with (bottom) nearest-neighbor GTPase modulation. Allowing GTPase rate modulation requires one additional parameter: the fold increase in GTPase rate due to the nearest-neighbor influence. (B) Comparison between measured (black circles) and predicted (the blackest line corresponds to a onefold increase in GTPase rates and the bluest corresponds to a 1000-fold increase) growth rates. All four scenarios can recapitulate observed growth rates (left plot). Predicted catastrophe frequency as a function of concentration for different fold increases in GTPase rate (right plot). Varying the magnitude of GTPase rate modulation has a significant effect on the concentration dependence of the catastrophe frequency. The y-axis is linear in the larger plot. The smaller inset graph displays the same data, but the y-axis is on log scale. (C) Comparison between measured (black circles) and predicted (the blackest line corresponds to a onefold increase in GTPase rates and the bluest corresponds to a 1000-fold increase) growth rates in the propagation-limited GTPase model. All four scenarios can recapitulate observed growth rates (left plot). Predicted catastrophe frequency as a function of concentration for different fold increases in GTPase rate in the propagation-limited GTPase model (right plot). Artificially limiting the propagation of wavelike GTPase activity reverts the changes in predicted concentration dependence of catastrophe frequency observed in the original nearest-neighbor GTPase modulation model. The y-axis is linear in the larger plot. The smaller inset graph displays the same data, but the y-axis is on log-scale.

