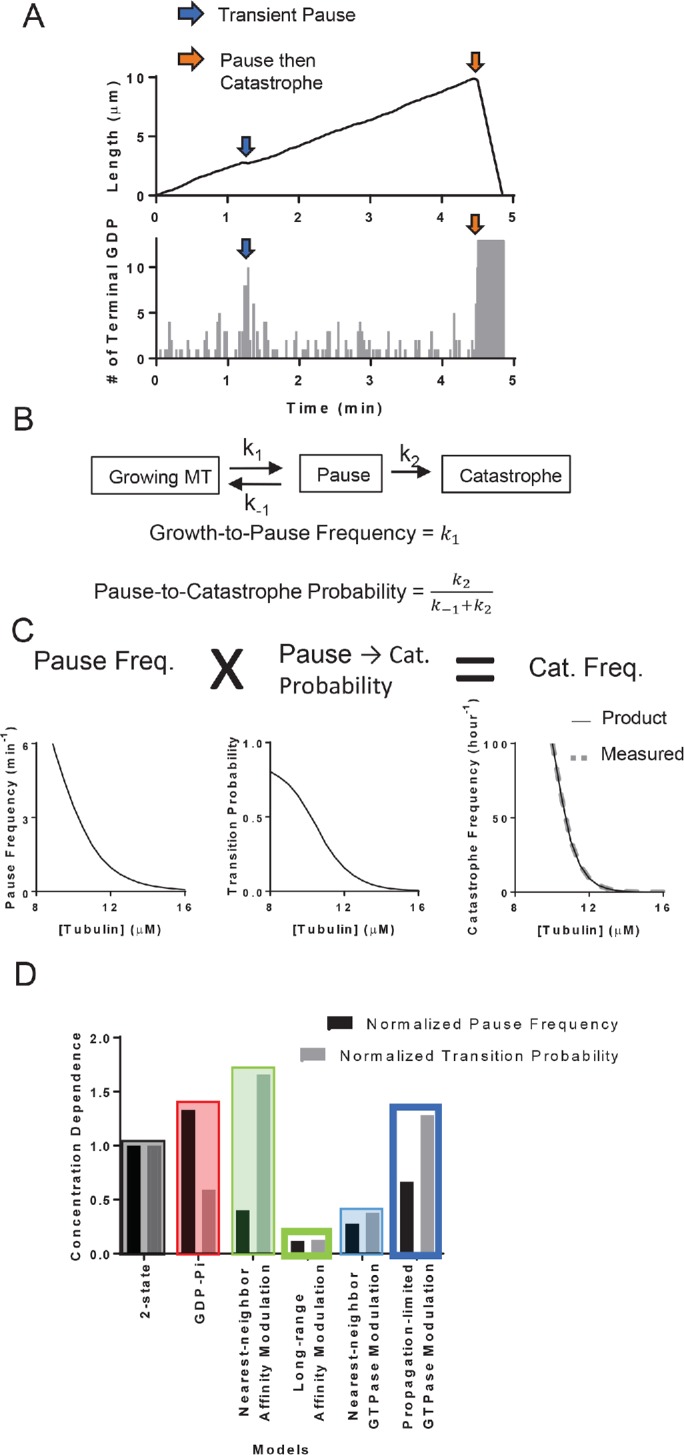
FIGURE 6:

Microtubule catastrophe can be decomposed into two separate steps. (A) The plot of MT length vs. time (top panel) and the corresponding plot of terminal GDP-tubulin vs. time (bottom panel). The exposure of GDP-tubulins at the ends of some protofilaments (blue arrows) leads to transient pausing. The exposure at the end of all protofilaments can follow partial loss of the GTP stabilizing cap (orange arrows), leading to transient pausing followed by catastrophe. (B) Diagram of transient pausing and catastrophe as elementary processes (top). Growth-to-pause frequencies and pause-to-catastrophe probability defined in terms of the reaction rates to the elementary processes (bottom). (C) Plot of growth-to-pause frequencies (left), pause-to-catastrophe probabilities (middle), and the catastrophe frequencies (right) as functions of αβ-tubulin concentrations in two-state model. The multiplicative product (black line, bottom plot) of the growth-to-pause frequencies and the pause-to-catastrophe probabilities match the value of the predicted catastrophe frequency (gray dashed line, bottom plot). (D) The concentration dependencies of the growth-to-pause frequencies and the pause-to-catastrophe probabilities of different models normalized to the two-state model. Here, we defined the concentration dependence as the ratio of the growth-to-pause frequencies or the pause-to-catastrophe probabilities at 9.5 over 13.5 µM.
