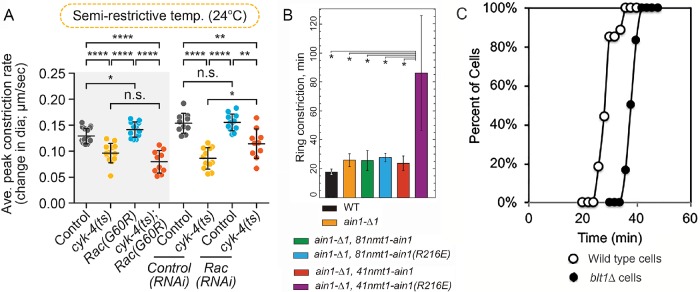
FIGURE 3:
Comparison of data presentation for three experiments on the constriction of cytokinetic contractile rings with several perturbations. (A) Rate of ring constriction in Caenorhabditis elegans embryos from Zhuravlev et al. (2017). Error bars represent SD; p values were obtained by an unpaired, two-tailed Student’s t test; n.s., p ≥ 0.05; *, p < 0.05; **, p < 0.01; ****, p < 0.0001. Sample sizes 10–12. (B) Time to complete ring constriction in Schizosaccharomyces pombe from Li et al. (2016). Error bars, SD; n ≥ 10 cells. *, p < 0.05 obtained with one-tailed t tests for two samples with unequal variance. (C) Kaplan-Meier outcomes plots comparing the times (relative to spindle pole body separation) of the onset of contractile ring constriction in populations of (○) wild-type and (⬤) blt1∆ fission yeast cells from Goss et al. (2014). A log-rank test determined that the curves differed with p < 0.0001.

