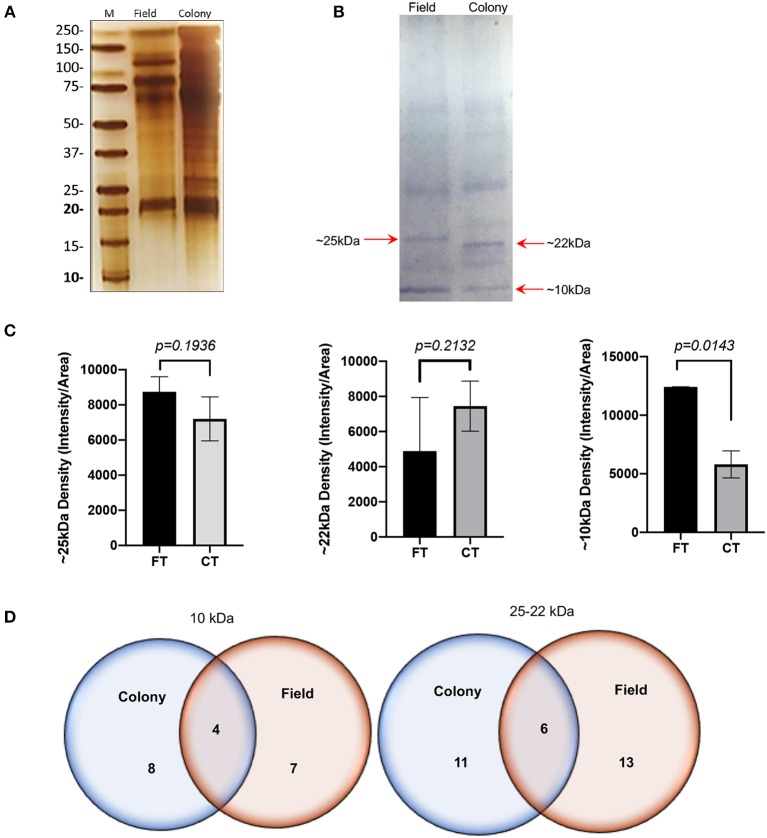
Figure 1.
SGE protein analysis Colony and Field. (A) Protein SDS-PAGE (silver stain). (B) Immunoblot using human samples from healthy volunteers. (C) Intensity comparison of immunogenic bands from the immunoblot, and (D) Schematic representation of proteins identified by mass spectrometry. Figure displaying the median with interquartile range. Significance evaluated by the Mann-Whitney test with a p < 0.05.

