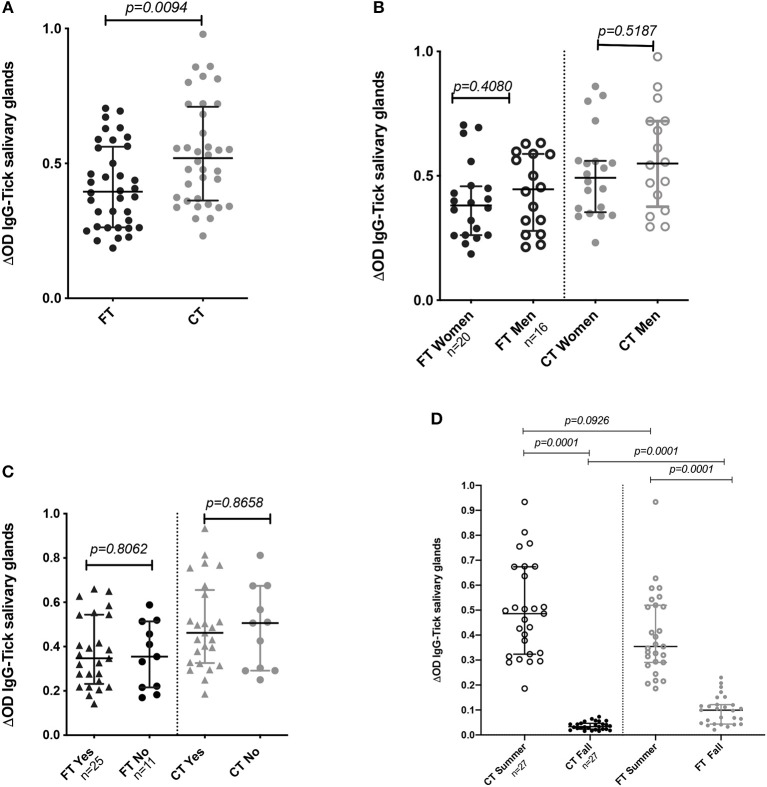
Figure 2.
IgG Antibody levels in human samples tested by ELISA. (A) Total IgG antibody levels against FT-SGE and CT-SGE. (B) Comparison of anti SGE antibodies levels in women and men enrolled in summer 2018. (C) Comparison of IgG antibodies levels by use of repellent. (D) Comparison of antibody levels in Summer and Fall of 2018. Figure displaying the median with interquartile range.Significance evaluated by the Mann-Whitney test with a p < 0.05.

