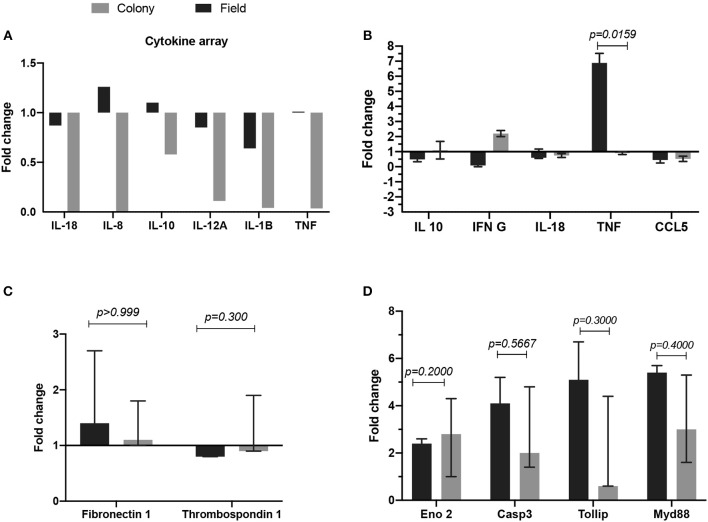
Figure 3.
Comparison of fold change gene expression between cells treated with either FT-SGE or CT-SGE. (A) Cytokine array values in U937 cells. (B) qRT-PCR results U937 cells cytokine testing. (C) Fold change gene expression in endothelial cells, and (D) gene expression in neurons. Figure displaying the median with interquartile range. Significance was tested by the Mann-Whitney test with a p < 0.05.

