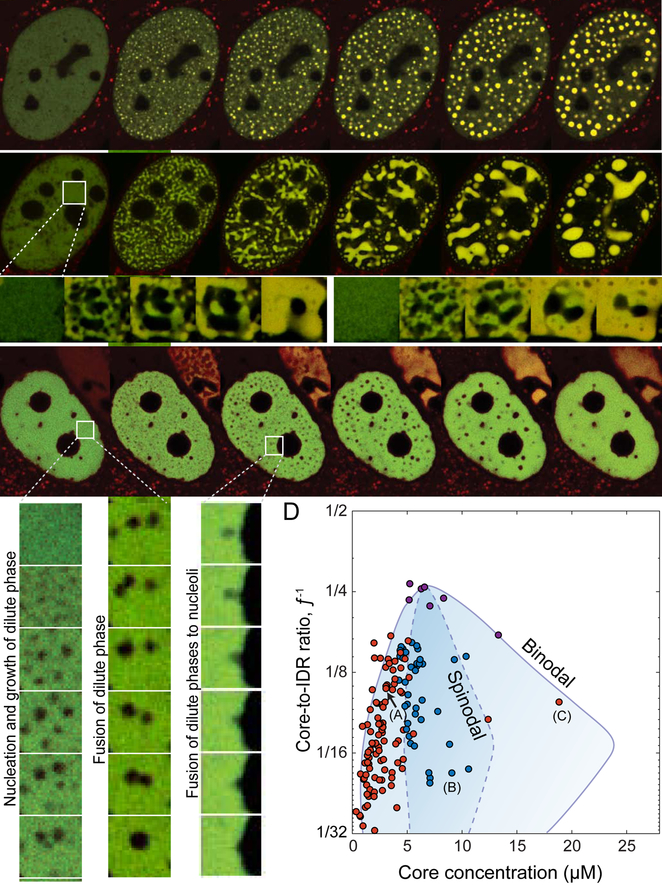
Figure 4. Distinct modes of FUSN Corelet phase separation.
(A) Phase separation via nucleation and growth occurs at low Core concentration. See Video S2 . (B) At intermediate Core concentration phase separation initiates with the rapid formation of elongated interconnected domains, as in spinodal decomposition. Insets show repeated activation of the same cellular region at higher time resolution, showing differing morphology evolution. See Video S3. (C) At very high Core concentration nucleation and growth of dilute phases within a dense phase was observed. Insets show enlarged nucleation (left) and subsequent fusion of dilute phases (center), as well as dilute phase fusion with a nucleolus (right). See Video S4. (D) Positioning phase separating cells according to their valence and core concentration at the time of activation and labeling them accordingly to the observed condensation mode delineate the binodal and minimal spinodal regions of the phase diagram. Red circles indicate average nuclear concentrations for which phase separation follows nucleation and growth of dense phases (left) or dilute phases (right), and blue circles are concentrations where spinodal decomposition is observed. Unlike the diagram in Figure 2D, points represent mean nuclear fluorescence upon activation, 2 sec after light activation. Purple symbols represent cells in which the exact condensation mode could not be conclusively determined (see Figure S5B). Binodal curves from Figure 2B. Approximate spinodal curve (dashed line) drawn to encapsulate average nuclear concentrations showing spinodal decomposition morphologies. Cells depicted in (A-C) are indicated. Scale bars are 2 μm for enlarged insets and 5 μm elsewhere.

