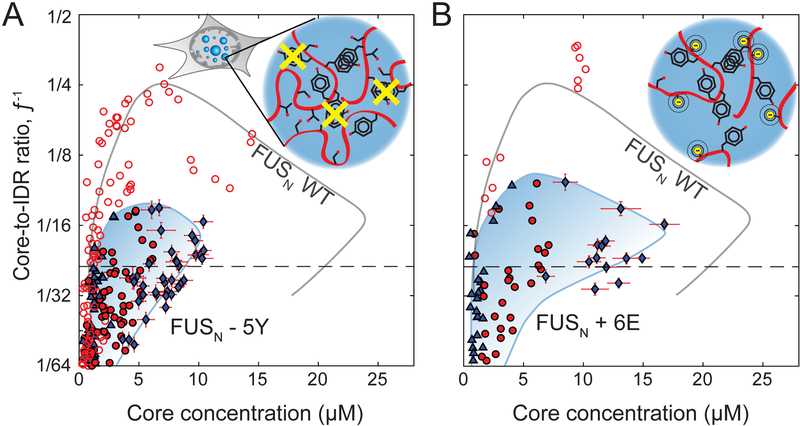
Figure 5. Phase diagrams show strong dependence on chemical attributes of protein sequence.
(A) Phase diagram of FUSN-5Y Corelets, with respect to Core concentration and Core-to-IDR ratio, f−1. Symbols as in Fig. 3B. Full valency line shown as dashed horizontal and FUSN-WT Corelets binodal line from Figure 3B is shown in gray for comparison. Inset schematic shows mutations removing a subset of FUSN tyrosine residues (Y->S) (B) Phase diagram of phosphomimic FUSN+6E Corelets. Inset shows schematic of how S/T mutations to glutamic acid (E) introduce negative charge, as would phosphorylation of these sites. Axes, lines and symbol definitions as in (A).

